Chapter 7 Nonparametric Statistics
Chapter 7 Nonparametric Statistics. 7.1 - Introduction. Parametric tests Have a requirement about the distribution of the population Nonparametric tests Have no such requirement. 7.2 – The Sign Test.


Chapter 7 Nonparametric Statistics
E N D
Presentation Transcript
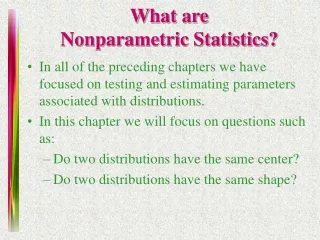
7.1 - Introduction • Parametric tests • Have a requirement about the distribution of the population • Nonparametric tests • Have no such requirement
7.2 – The Sign Test Purpose: To determine if a set of data consisting of + and − signs has an unusually small number of one sign or another. Let • total number of + and − signs in the data • number of times the less frequent sign appears The test statistic is
The Sign Test Critical value • : See Table C.5 • : or • Reject H0 if test statistic critical value P-value – is and is Requirement • The sample is random
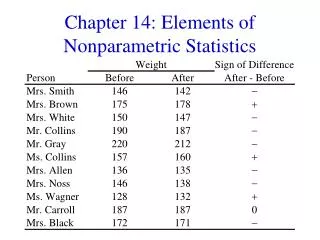
Example 7.2.1 The first row of the table below shows the number of children’s books in 11 randomly selected homes with children in a town. Use the data to test the claim that the median number of books in homes with children in this town is greater than 12.
Example 7.2.1 Parameter: the median number of books Hypotheses: H0: , H1: Test statistic: • , • Critical value: 1 P-value: • Reject H0 : The data support the claim
7.3 – The Wilcoxon Signed-Rank Test Do scores on a writing survey improve from the beginning to the end of the semester? • Test the claim that the median of the population of the differences of the scores, denoted , is positive • Hypotheses: H0: , H1:
Test Statistic Calculate the sum of the positive signed ranks and the sum of the negative signed ranks: Theorem 7.3.1 Assuming the distribution of the differences is symmetric around 0, then the random variable is approximately normally distributed with mean and variance
The Wilcoxon Signed-Rank Test Purpose: To test the null hypothesis H0: where m is the population median of the differences of a set of paired data. • Let smaller of and Test statistic
The Wilcoxon Signed-Rank Test Critical value • : See Table C.6 • : or • Reject H0 if test statistic critical value Requirements • The sample is random • The population of differences has a distribution that is symmetric
Example Test statistic: Critical value: 8 P-value: • Reject H0: The data support the claim
7.4 – The Wilcoxon Rank-Sum Test There are two commonly used techniques for throwing a shot put: glide and rotational. The first and third rows of the table below give the maximum distances (in m) of 12 different athletes using the glide method and 13 athletes using the rotational method at international competitions (data collected by David Meyer, 2010). Use this data to test the claim that there is not a significant difference between these two methods.
The Wilcoxon Rank-Sum Test Parameters • median of all distances using the glide method • median of all distances using the rotation method Hypotheses: H0: , H1: Test statistic: Add ranks from the first sample
Theorem 7.4.1 If there are no ties and both populations have the same continuous distribution, then is an observed value of a random variable with mean and variance
The Wilcoxon Rank-Sum Test Purpose: To test the null hypothesis H0: where and are the medians of two independent populations with continuous distributions. Let • and sample sizes where 2 • Rank all the values from 1 to 2 • sum of the ranks from the first sample
The Wilcoxon Rank-Sum Test Test statistic: Critical value: See Table C.7 • Reject H0 if critical value P-value:For a one-tail test • Double this probability for a two-tail test Requirement • The samples are random and independent
Example , Critical value: 119 • Do not reject H0: There is not a statistically significant difference between the medians of the two methods
7.5 – The Runs Test for Randomness Purpose: To test the claim that a set of data with two types of values is arranged randomly Definition 7.5.1 A run is a sequence of data of the same type preceded and followed by data of a different type or by no data at all
Example 7.5.1 A classical music fan has a collection of songs composed by Bach and Vivaldi on her MP3 player which is supposed to randomly choose songs. The order of the composer of the songs played is shown below. Test the claim that the composers are arranged randomly. • songs by Bach • songs by Vivaldi • Total of runs
Theorem 7.5.1 If the data values are chosen randomly, then is an observed value of a random variable with p.m.f. for
Theorem 7.5.1 As, the distribution of approaches a normal distribution with mean and variance
The Runs Test for Randomness Null hypothesis: H0: The data are arranged randomly Test statistic: Critical values: See Table C.8 • Reject H0 if the smaller c.v. or the larger c.v. P-value: Approximately twice the extreme region under the standard normal bell curve bounded by
Example 7.5.1 Hypotheses: H0: The composers are arranged randomly H1: The composers are not arranged randomly Test statistic: Critical values: 7 and 17 P-value:
Example 7.5.1 Conclusion • Do not reject H0 • It appears that the songs are randomly chosen