Nonparametric Statistics
Learn about nonparametric situations where population distributions are unknown, advantages, disadvantages, Sign Test, Rank-Sum Test, Spearman Rank Correlation, and Runs Test for randomness.


Nonparametric Statistics
E N D
Presentation Transcript
Chapter 12 Nonparametric Statistics Understandable Statistics Ninth Edition By Brase and Brase Prepared by Yixun Shi Bloomsburg University of Pennsylvania
Nonparametric Situations • At times, we will not know anything about the distributions of the populations from which we are sampling. • Recall that all of our inference techniques thus far have assumed either a normal or binomial distribution from the populations of interest.
Nonparametric Tests • Advantages: • Easy to apply • Quite general in nature • Disadvantages: • Wastes information • Accept the null hypothesis more often than with other tests • Less sensitive
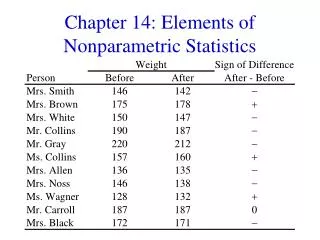
The Sign Test • We wish to compare two populations. • Populations are not independent
Rank-Sum Test • Data values from the two populations are not paired. • Normal assumptions are not satisfied, or are at least questionable.
Spearman Rank Correlation • Suppose we have a sample of size n of paired data points (x, y). • The data points, (x, y), must be ranked variables. • The Spearman Rank Correlation will tell us if the data pairs have a monotone increasing or a monotone decreasing relationship.
Runs Test for Randomness • Definitions: