Understanding Atmospheric Gases: Composition and Variability
50 likes | 184 Vues
Explore the various gases that compose our atmosphere through this informative slideshow. Key gases and their respective formulas include Nitrogen (N2 - 78.08%), Oxygen (O2 - 20.95%), Water Vapor (H2O - 0-4%), Argon (Ar - 0.93%), and Carbon Dioxide (CO2 - 0.0360%). Other trace gases include Neon, Helium, Methane, and Ozone, each varying in percentage. Understanding these compositions is crucial for grasping climate change, conducting research, and planning environmental strategies. Join us for insights into what fills our skies!

Understanding Atmospheric Gases: Composition and Variability
E N D
Presentation Transcript
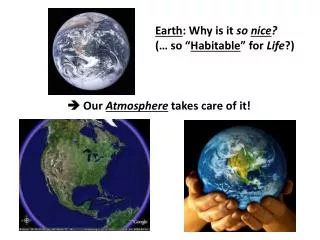
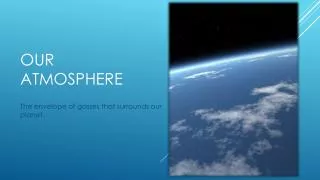
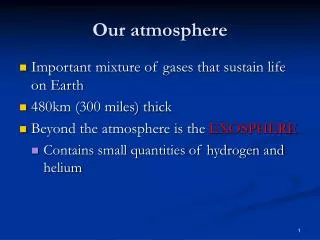
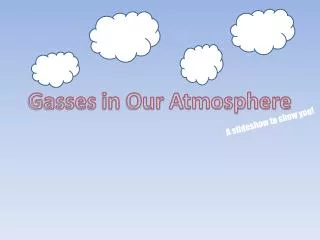
GassesinOurAtmosphere A slideshow to show you!
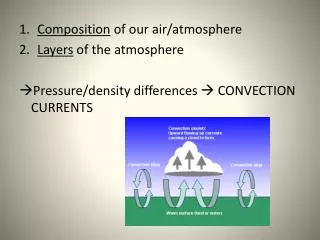
The Figures In our atmosphere there are different types of gases. These figures show types of gasses and how much is in the atmosphere. Gases, their formulas and percentages: Nitrogen – N2 – 78.08% Oxygen – O2 – 20.95% Water – H20 – 0 – 4% (Varies.) Argon – Ar – 0.93% Carbon Dioxide – CO2 – 0.0360% (Varies.) Neon – Ne – 0.0018% (Inert Gas) Helium – He – 0.0005% (Inert Gas) Methane – CH4 – 0.00017% (Varies.) Hydrogen – H2 – 0.00004% Nitrous Oxide – N2O – 0.00003% (Varies.) Ozone – O3 – 0.000004% (Varies.)
What Do Those Figures Mean? Those figures show what gases that make up our atmosphere. Some of the gasses vary like water, carbon dioxide, methane, nitrous oxide& ozone which means they change their figures. The figures also show what their formula is as well. The figures give people an idea of what is in our atmosphere and how much there is off it, which helps people figure out climate change, research, ways to increase/lessen the gas etc.
Thanks for Watching! Information Source: http://www.physicalgeography.net/fundamentals/7a.html