Download
1 / 29
440 likes | 628 Vues
UrbanSim is a comprehensive tool developed at the University of Washington, aimed at enhancing urban planning through integrated modeling of land use, transportation, and environmental factors. This interdisciplinary project, led by Alan Borning and Paul Waddell, facilitates exploring policy alternatives for urban growth, transit-oriented development, and infrastructure investments. It employs agent-based models to simulate residential and employment location dynamics, enabling stakeholders to visualize potential urban futures with realistic scenarios. Fully operational and open-source, UrbanSim supports informed decision-making across cities worldwide.

E N D
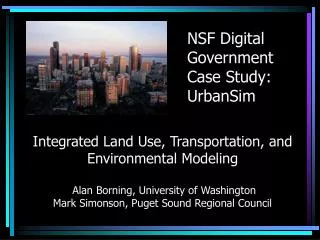
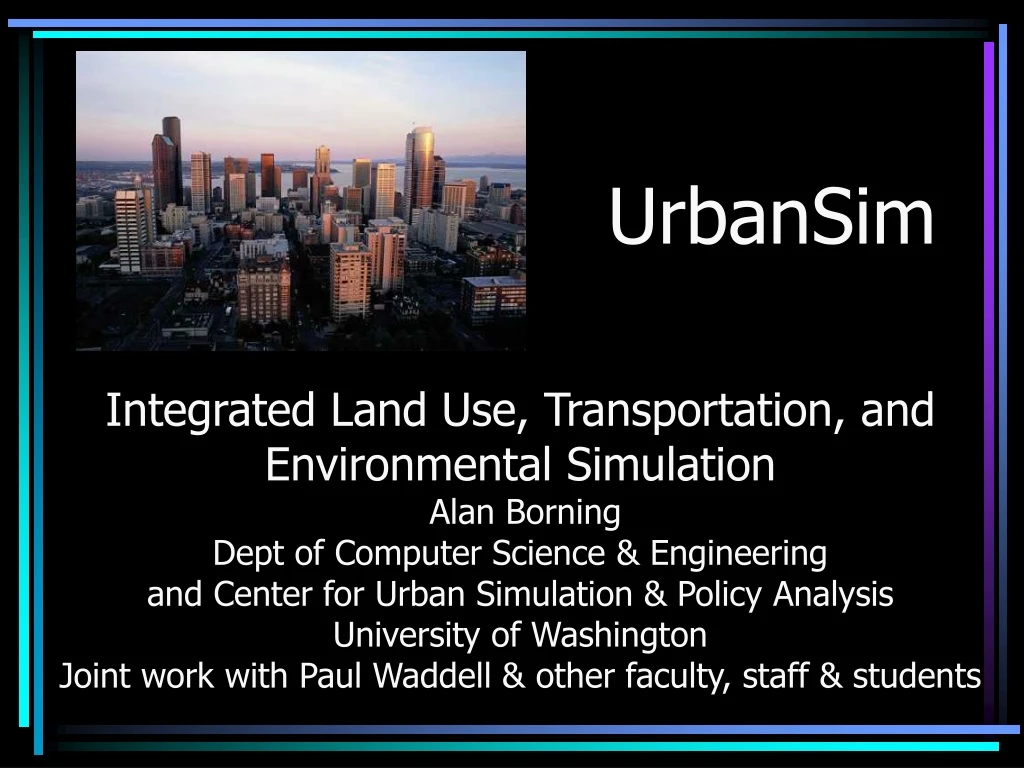
UrbanSim Integrated Land Use, Transportation, and Environmental Simulation Alan BorningDept of Computer Science & Engineeringand Center for Urban Simulation & Policy AnalysisUniversity of WashingtonJoint work with Paul Waddell & other faculty, staff & students
Using Models in Urban Planning • Integrated land use and transportation models can provide an important tool for exploring policy alternatives and possible urban futures • What if …? • We built a new light rail line, and added significant connecting bus service? • We established an urban growth boundary and zoned for increased density and mixed-use, with the goal of promoting transit-oriented development? • We built a network of new freeways and widened feeder arterials? • Analogy: SimCity, but with requirements for realism • Unfortunately, models in standard use are inadequate
UrbanSim • Highly interdisciplinary project at the University of Washington • Participation from faculty and students from many schools and departments • Paul Waddell, project director (Evans School of Public Affairs) • Alan Borning, co-director (Department of Computer Science & Engineering) • Major funding from the Digital Government program, National Science Foundation • Additional funding from Puget Sound Regional Council, Environmental Protection Agency, plus other federal, state, and regional agencies
UrbanSim (2) • The system is fully operational and documented, and is distributed under an open source license (GPL) via our website www.urbansim.org • Used experimentally in Honolulu, Hawaii; Eugene, Oregon; Salt Lake City, Utah; Houston, Texas, Paris, France; Tel Aviv, Israel • First major application to a public planning project starting this summer in Puget Sound region (Seattle and surrounding metropolitan area)
Outline • UrbanSim inputs and outputs • UrbanSim system design • (Very brief!) Our software engineering methodology • Current work on enabling citizen access to UrbanSim’s results and simulation capabilities • (If time allows) Value Sensitive Design theory and methodology
150 Meter Grid Cells 150 square meter grid cellsGreen Lake neighborhood, Seattle
UrbanSim – System Design • Modeling: • Provide interacting component models that represent different agents and processes in the urban environment • Component models loosely coupled (for software engineering reasons); communicate via a shared database • Dynamically simulate annual time steps • Example component models: • Residential Location • Employment Location • Land Price • Real Estate Development • Demographic transition • Travel (external model)
Example Model - Residential Location • Households that need to be placed in new locations in a given simulated year: • Existing household predicted to move by Household Relocation Mode • New households from Demographic Transition Model • Available housing to move into: • Units vacated by households that moved out • New housing from the Real Estate Developer Model • Residential Location Choice Model places these households in available housing
Residential Location Model (2) • A probabilistic model • Outcome: which grid cell the household moves to • Influences on choice include: • Household characteristics (income, age of head, number of children, race, etc) • Characteristics of available housing (cost, type, neighborhood land use mix and density, access to neighborhood employment, travel time to central business district, etc) • Calibrated to local data for the region being simulated • Database takes care of accounting for where household is located, which units are occupied, etc
Indicators • Indicators provide the principal mechanism for summarizing results from the simulations for different stakeholders • Indicators can be computed for various geographies (the region as a whole, cities, neighborhoods, grid cells, etc) • Examples: • Population density • Average household income • Acres of vacant developable land
Example simulation output: Map-based indicator display forPuget Soundregion
Results fromSalt Lake City:comparing predicted land prices in 2030 for the adopted Long Range Plan with a no-build alternative
Aside regarding indicators and the workshop theme • National Infrastructure for Community Statistics: a proposed web-based utility that facilitates access to detailed, current community-level statistics • What if we also facilitated access to selected community-level statistics for the next 30 simulated years for various possible scenarios of the future?
More Direct Support for Public Access and Deliberation • Three interrelated projects: • Indicator Browser • A web-based system for browsing through scenarios and indicators • Indicator Perspectives • Organizations with widely differing views on land use, transportation, and the environment analyze and comment on indicators and scenarios • U-Build-It • Planned system to give direct access to the simulation to citizens and elected officials
Indicator Browser • Web-based chooser for selecting scenarios and indicators to example • Dynamic generation of output • Ready-to-hand documentation • Documentation is linked directly from chooser • Live documentation – includes: • Actual SQL code to compute indicator • Test cases for SQL code
Balancing Freedom from Bias with Value Advocacy • Wanted to describe why a given indicator was important to different stakeholders • We found this very difficult to do within relatively neutral technical documentation • Approach: also provide Indicator perspectives • Allow organizations or groups to present their own perspective on which indicators are important and why, and how to interpret them • In early stages - two prototype perspectives developed so far
Indicator Perspectives – Initial Partners • Northwest Environment Watch • an environmental group • Washington Association of Realtors • a business association • King County Budget Office, Benchmark Program • a government agency
U-Build-It • Would like members of advocacy groups, business associations, and motivated citizens to be able to construct their own scenarios to be simulated • But UrbanSim is quite complex • Approach: a web-based system that will provide a rich set of component parts that can be mixed and matched to assemble a scenario to be simulated • User chooses among various alternatives (3 alternatives for a light rail system, 4 zoning alternatives, etc) • System assembles these into a scenario and (if not simulated already) puts this in a queue to be run • Results to be available via the Indicator Browser
Value Sensitive Design • An approach to the design of technology that accounts for human values in a principled and comprehensive manner throughout the design process • Central to our work on more direct support for public access and deliberation • Primary developer of VSD: Batya Friedman, Information School, University of Washington
Value Sensitive Design Contributions • Principled basis for considering value issues in the design of a technological system • Actively design the technology to support particular values (rather than engaging in a retrospective critique) • Methodology explicitly designed to consider: • Potentially diverse user population • Both direct and indirect stakeholders
Applying VSD to UrbanSim – One Example • How do we deal with the multitude of strongly held and often conflicting values held by different stakeholders? We distinguish: • Explicitly supported values • Stakeholder values • Explicitly supported values are not the same as the personal values of the designers – they are subject to a principled analysis of arguments for their inclusion
Explicitly Supported Values • These are taken as given, and are explicitly supported by the system as well as possible • Principal values: • Support for democratic process • Provide infrastructure that allows users to articulate and investigate values that are of greatest importance to them • Fairness (and specifically freedom from bias) • As far as we are able, do not privilege one mode of transportation, policy, etc over another • Transparency
Example Stakeholder Values • Clean air • Economic growth • Housing affordability • Individual property rights • Low taxes • Open space preservation • Social equity • Transportation options for disabled people • Walkable neighborhoods
Stakeholder Values (2) • Stakeholder values may be in conflict • A particular choice or weighting of these values should not be built into the system • Being able to answer questions about certain stakeholder values may have significant design implications (e.g. biodiversity)
For more information UrbanSim project website: www.urbansim.orgContact information: Alan Borning borning@cs.washington.edu