Normal Density Fitting: Melbourne Temperature and Excel Probs
Understand normal distribution, density curves, fitting data, computation of probabilities, and Z-score views for statistical analysis. Learn Excel functions like NORMDIST for calculations. Explore Z-score interpretations and the 68-95-99.7% rule.

Normal Density Fitting: Melbourne Temperature and Excel Probs
E N D
Presentation Transcript
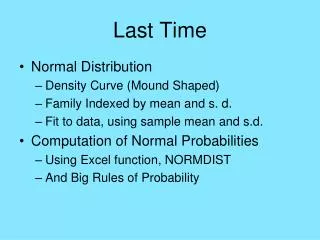
Last Time • Normal Distribution • Density Curve (Mound Shaped) • Family Indexed by mean and s. d. • Fit to data, using sample mean and s.d. • Computation of Normal Probabilities • Using Excel function, NORMDIST • And Big Rules of Probability
Reading In Textbook Approximate Reading for Today’s Material: Pages 61-62, 66-70, 59-61, 322-326 Approximate Reading for Next Class: Pages 337-344, 488-498
Normal Density Fitting Idea: Choose μ and σ to fit normal density to histogram of data, Approach: IF the distribution is “mound shaped” & outliers are negligible THEN a “good” choice of normal model is:
Normal Density Fitting Melbourne Average Temperature Data
Computation of Normal Probs EXCEL Computation: probs given by “lower areas” E.g. for X ~ N(1,0.5) P{X ≤ 1.3} = 0.726
Computation of Normal Probs Computation of upper areas: (use “1 –”, i.e. “not” formula) = 1 -
Computation of Normal Probs Computation of areas over intervals: (use subtraction) = -
Z-score view of populations Idea: Reproducible view of “where data point lies in population”
Z-score view of populations Idea: Reproducible view of “where data point lies in population” Context 1: List of Numbers Context 2: Probability distribution
Z-score view of Lists of #s Idea: Reproducible view of “where data point lies in population”
Z-score view of Lists of #s Idea: Reproducible view of “where data point lies in population” • Thought model: population is Normal
Z-score view of Lists of #s Idea: Reproducible view of “where data point lies in population” • Thought model: population is Normal • Population mean: μ
Z-score view of Lists of #s Idea: Reproducible view of “where data point lies in population” • Thought model: population is Normal • Population mean: μ • Population standard deviation: σ
Z-score view of Lists of #s Idea: Reproducible view of “where data point lies in population” • Thought model: population is Normal • Population mean: μ • Population standard deviation: σ Interpret data as “s.d.s away from mean”
Z-score view of Lists of #s Approach: • Transform data
Z-score view of Lists of #s Approach: • Transform data • By subtracting mean & dividing by s.d
Z-score view of Lists of #s Approach: • Transform data • By subtracting mean & dividing by s.d. • To get
Z-score view of Lists of #s Approach: • Transform data • By subtracting mean & dividing by s.d. • To get (gives mean 0, s.d. 1)
Z-score view of Lists of #s Approach: • Transform data • By subtracting mean & dividing by s.d. • To get (gives mean 0, s.d. 1) • Interpret as
Z-score view of Lists of #s Approach: • Transform data • By subtracting mean & dividing by s.d. • To get (gives mean 0, s.d. 1) • Interpret as • I.e. “ is sd’s above the mean”
Z-score view of Normal Dist. Approach: • For
Z-score view of Normal Dist. Approach: • For • Subtract mean & divide by s.d
Z-score view of Normal Dist. Approach: • For • Subtract mean & divide by s.d. • To get
Z-score view of Normal Dist. Approach: • For • Subtract mean & divide by s.d. • To get (gives mean 0, s.d. 1, i.e. Standard Normal)
Z-score view of Normal Dist. Approach: • For • Subtract mean & divide by s.d. • To get (gives mean 0, s.d. 1, i.e. Standard Normal) • Interpret as
Z-score view of Normal Dist. Approach: • For • Subtract mean & divide by s.d. • To get (gives mean 0, s.d. 1, i.e. Standard Normal) • Interpret as • I.e. “ is sd’s above the mean”
Z-score view of Normal Dist. HW: 1.117
Interpretation of Z-scores Z-scores
Interpretation of Z-scores Z-scores are on N(0,1) scale,
Interpretation of Z-scores Z-scores are on N(0,1) scale,
Interpretation of Z-scores Z-scores are on N(0,1) scale, so use areas to interpret them
Interpretation of Z-scores Z-scores are on N(0,1) scale, so use areas to interpret them Important Areas:
Interpretation of Z-scores Z-scores are on N(0,1) scale, so use areas to interpret them Important Areas: • Within 1 sd of mean
Interpretation of Z-scores Z-scores are on N(0,1) scale, so use areas to interpret them Important Areas: • Within 1 sd of mean
Interpretation of Z-scores Z-scores are on N(0,1) scale, so use areas to interpret them Important Areas: • Within 1 sd of mean “the majority”
Interpretation of Z-scores Z-scores are on N(0,1) scale, so use areas to interpret them Important Areas: • Within 1 sd of mean “the majority” ≈ 68%
Interpretation of Z-scores Z-scores are on N(0,1) scale, so use areas to interpret them Important Areas: 2. Within 2 sd of mean “really most” ≈ 95%
Interpretation of Z-scores Z-scores are on N(0,1) scale, so use areas to interpret them Important Areas: 3. Within 3 sd of mean “almost all” ≈ 99.7%
Interpretation of Z-scores Summary: these are called the “68 - 95 - 99.7 % Rule”
Interpretation of Z-scores Summary: these are called the “68 - 95 - 99.7 % Rule” Mean +- 1 - 2 – 3 sd’s
Interpretation of Z-scores Summary: “68 - 95 - 99.7 % Rule” Excel Calculation From Class Example 9: http://www.stat-or.unc.edu/webspace/courses/marron/UNCstor155-2009/ClassNotes/Stor155Eg9.xls
Interpretation of Z-scores Summary: “68 - 95 - 99.7 % Rule” Excel Calculation
Interpretation of Z-scores HW: 1.115, 1.116 (50%, 2.5%, 0.18-0.22) 1.119
Inverse Normal Probs Idea, for a given cutoff value, x
Inverse Normal Probs Idea, for a given cutoff value, x Calculated P{X < x}
Inverse Normal Probs Idea, for a given cutoff value, x Calculated P{X < x} as Area under normal density
Inverse Normal Probs Idea, for a given cutoff value, x Calculated P{X < x} as Area under normal density Using Excel function: NORMDIST
Inverse Normal Probs Now for a given P{X < x}, i.e. Area
Inverse Normal Probs Now for a given P{X < x}, i.e. Area Find corresponding cutoff x
Inverse Normal Probs Now for a given P{X < x}, i.e. Area Find corresponding cutoff x Terminology: