Capacity Factor Summary
Explore the significant economic benefits of developing wind energy in Arizona, including job creation and local revenue generation over the construction and operational phases. Dive into the detailed analysis of the economic ripple effect generated by wind farms in the state, as computed by experts. Discover how this sustainable energy source contributes to the local economy and job market.
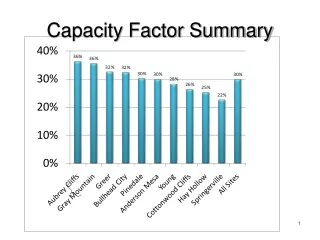

Capacity Factor Summary
E N D
Presentation Transcript
Wind as a Percentage of Electricity Consumption Source: Wind Powering America update 2-3-09 Note: Figure only includes the 20 countries with the most installed wind capacity at the end of 2007 2
Arizona Map NAU State NAU Army NAU Loan TEP UWRAP/TEP 4
Black & Veatch • Arizona Renewable Energy Assessment, 2007 • APS, TEP, SRP • Near term • Transmission >69 kV • Land use • Constructability • 991 MW Source: Arizona Renewable Energy Assessment, Final Report, Project Numbe 145888, Black & Veatch, 2007 5
NAU Wind Assessment Windy = Class 3 or better “Developable” = Remove land not suitable for wind development 6
Arizona – Economic Impacts from 100 MW of new wind development in Coconino County Wind energy’s economic “ripple effect” Indirect & Induced Impacts Totals (construction + 20yrs) Direct Impacts • Construction Phase: • 428 new jobs • $49.6 M to local economies • Operational Phase: • 15 local jobs • $3.2 M/yr to local economies • Construction Phase: • 67 new jobs • $32.7 M to local economies • Construction workers, management, administrative, gas and gas station workers, etc. • Operational Phase: • 6 to 15 new long-term jobs • $0.93 M/yr to local economies • O&M Jobs, road maintenance, hardware store, supply parts, etc. Total economic benefit = $164.9 million New local jobs during construction = 495 New local long-term jobs = 21 to 30 Supporting businesses, such as contractors, equipment suppliers of subcomponents, grocery store clerks, retail sales, etc. Construction Phase = 1-2 years Operational Phase = 20+ years As computed by K. Wadsack at NAU using the NREL “Jobs and Economic Development Impacts” (JEDI) model. Slide from the Wind Powering America update 2-09.
Wind Energy’s Economic impacts On-site direct, off-site direct, Indirect, Induced Wind energy’s economic “ripple effect” Direct Impacts • Indirect Impacts • These are jobs in and payments made to supporting businesses, such as bankers financing the construction, contractor, manufacturers and equipment suppliers of subcomponents. Induced Impacts These jobs and earnings result from the spending by people directly and indirectly supported by the project, including benefits to grocery store clerks, retail salespeople and child care providers.
Colorado – Economic Impacts from 1000 MW of new wind development Wind energy’s economic “ripple effect” Totals (construction + 20yrs) Direct Impacts Indirect & Induced Impacts • Payments to Landowners: • $2.5 Million/yr • Local Property Tax Revenue: • $4.6 Million/yr • Construction Phase: • 912 new jobs • $133.6 M to local economies • Operational Phase: • 181 new long-term jobs • $19.3 M/yr to local economies • Construction Phase: • 807 new jobs • $92.7 M to local economies • Operational Phase: • 129 local jobs • $15.6 M/yr to local economies Total economic benefit = $924.3 million New local jobs during construction = 1,719 New local long-term jobs = 310 Construction Phase = 1-2 years Operational Phase = 20+ years All jobs rounded to the nearest 50 jobs; All values greater than $10 million are rounded to the nearest million
11 Source: Wind Powering America Update, 2-09
Installed Project Costs Are On the Rise, After a Long Period of Decline Increase of ~$700/kW Source: Wind Powering America update 2-3-09 Note: Includes 227 projects built from 1983-2007, totaling ~13 GW (77% of capacity at end of 2007); additional ~2.8 GW of projects proposed for installation in 2008 12
Comparative Generation Costs 13 Source: Wind Powering America update 2-3-09
Installed Wind Capacity 14 Source: Wind Powering America update 2-3-09
Outline Announcements Syllabus Wind Powering America Update Break Energy in the Wind Wind Turbine Technology Wind Energy Resource Wind Integration Wind Modeling 23
swrec.org 24
Announcements • Arizona Wind Working Group Meeting • September 10, 10am -12pm at the Drury Inn Conference Facilities • http://wind.nau.edu/azwwg/ • To register, RSVP to Pat.Ponce@nau.edu • Tour of Dry Lake Wind Farm: Cost $60. Register at http://swrec.org/tours_and_events.html • SWREC http://swrec.org/schedule.html • SWREC Volunteer: Contact Karin Wadsack • SWREC Green Jobs Seminar 25
Syllabus Handout and discuss Text Evaluation 26
How Much Energy Does the USA Use? ~ 690 Cholla Power Plants
Wind Anemometry Data Wind speed data taken by anemometers on tall towers (30 m to 60 m) 1-second data, averaged over 10-minutes with a standard deviation (i.e., turbulence) Wind direction vane Cup Anemometers at multiple heights Data loggers 35
Arizona Wind Data http://wind.nau.edu/anemometer/wind_data.shtml 36