Triaxial acceleration sensor
90 likes | 146 Vues
Discover a versatile tool integrating advanced sensors for geodetic, seismic, and oceanographic research. This tool offers precise measurements with large dynamic range and bandwidth, enabling observation of various phenomena. Its innovative design and capabilities make it ideal for studying complex geodynamic processes. Experience accurate data collection in diverse environmental conditions.

Triaxial acceleration sensor
E N D
Presentation Transcript
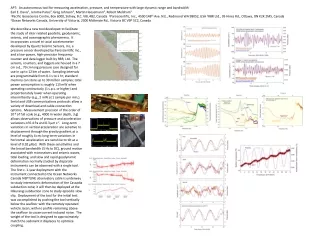
APT: An autonomous tool for measuring acceleration, pressure, and temperature with large dynamic range and bandwidth Earl E. Davis1, Jerome Paros2, Greg Johnson3, Martin Heesemann4, Robert Meldrum1 1Pacific Geoscience Centre, Box 6000, Sidney, B.C. V8L 4B2, Canada 2Paroscientific, Inc., 4500 148th Ave. N.E., Redmond WA 98052, USA 3RBR Ltd., 95 Hines Rd., Ottawa, ON K2K 2M5, Canada 4Ocean Networks Canada, University of Victoria, 2300 McKenzie Rd., Victoria BC V9P 5C2, Canada We describe a new tool developed to facilitate the study of inter-related geodetic, geodynamic, seismic, and oceanographic phenomena. It incorporates a novel tri-axial accelerometer developed by Quartz Seismic Sensors, Inc, a pressure sensor developed by Paroscientific Inc., and a low-power, high-precision frequency counter and data logger built by RBR, Ltd. The sensors, counters, and loggers are housed in a 7 cm o.d., 70 cm long pressure case designed for use in up to 12 km of water. Sampling intervals are programmable from 0.1 s to 1 hr; standard memory can store up to 30 million samples; total power consumption is roughly 115 mW when operating continuously (1 s.p.s. or higher) and proportionately lower when operating intermittently (e.g., 2 mW at 1 sample per min.). Serial and USB communications protocols allow a variety of download and cable-connection options. Measurement precision of the order of 10-8 of full scale (e.g., 4000 m water depth, 3 g) allows observations of pressure and acceleration variations of 0.4 Pa and 0.3 μm s-2. Long-term variations in vertical acceleration are sensitive to displacement through the gravity gradient at a level of roughly 4 cm; long-term variations in horizontal acceleration are sensitive to tilt at a level of 0.02 μRad. With these sensitivities and the broad bandwidth (5 Hz to DC), ground motion associated with microseisms and seismic waves, tidal loading, and slow and rapid geodynamic deformation normally studied by disparate instruments can be observed with a single tool. The first c. 1-year deployment with the instrument connected to the Ocean Networks Canada NEPTUNE observatory cable is underway to study interseismic deformation of the Cascadia subduction zone; it will then be deployed at the Hikurangi subduction zone to study episodic slow slip. Deployment of the tool for the initial test was accomplished by pushing the tool vertically below the seafloor with the remotely operated vehicle Jason, with no profile remaining above the seafloor to cause current-induced noise. The weight of the tool is designed to approximately match the sediment it displaces to optimize coupling.
Figure 1. Location of the ONC/NEPTUNE Clayoquot Slope deployment site (map), and the local distribution of the APT (acceleration, pressure, temperature), bottom pressure recorder (BPR), and buried broadband seismometer (BBBS) instruments (inset).
Figure 2. Instrument details, showing components during testing (a), assembled tool (b), and power consumption during intermittent (c) and continuous operation (d). Upper end cap w/ right-angle connector Battery Frequency counter and logger Triaxial acceleration sensor Period & fractioal period counting Sensor warm-up Intermittent operation Continuous operation 70 mW 72 mW 1 s
Fig. 3. Overview of the first 2.5 months of APT data, including storms and their microseismic consequences, and long-term variations associated with drift early in the records and with natural causes or possibly instrument settling at later times. Causes of intermittent spikes (having a frequency of occurrence of nominally 10-6) and noise on the temperature channel (see Fig. 6d; used for temperature compensation and thus a source of noise in the acceleration channels) are under investigation.
4. Examples of high-frequency data recorded by the APT and compared to the BBBS. Less than 2 days after the APT installation, 15-s-period surface waves from a Chile subduction earthquake provided an early demonstration of APT data quality and allowed the tool orientation to be determined by matching the horizontal channels to those of the nearby BBBS (a). The excellent match of waveforms also provided confirmation of the quality of ground coupling of each of the two instruments. Vertical data across the 200-m-spread of the linear sensor “array” show simultaneity of microseisms (b), and a match of pressure-ground motion energy transfer between microseismic and seismic signals (cf. b, c).
5. Comparative spectra of oceanographic signals (swell, microseisms, and infragravity waves) showing signal resolution by various instruments and sensors (a, b), and the level of oceanographic “noise” as it varies with water depth (c). The somewhat higher noise of the RBR counter relative to the Paroscientific counter is a trade-off of the much lower power required by the RBR unit.
6. Intermediate-period signals resolved by the BBBS and APT: Tidal tilt (in response to ocean loading) is resolved in the horizontal data of both instruments (a, b, d), and tidal gravity variations are seen in the vertical data (c). Acceleration and tilt observed with the BBBS are determined from the seismometer’s mass-balancing biasing current recorded at 24-bit resolution. Very regular tidal temperature variations seen by the APT at 1 m below the seafloor (d) do not reflect downward-diffused bottom-water temperature variations. Instead, they probably arise from pore-fluid motion driven by ocean tidal loading. The cause of the c. 0.2 mK noise in the temperature data is under investigation.