Download
1 / 16
160 likes | 261 Vues
This study compares sea-level pressure forecast errors along the East and West Coasts of the United States using multiple numerical model systems. Results show differences in accuracy and frequency of errors, with the ECMWF model outperforming others. The impact of data assimilation upgrades on forecast improvements is also examined.

E N D
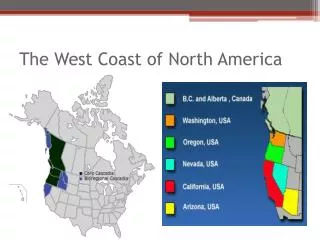
NCEP Model Comparisons over the East and West Coast of the US Lynn McMurdie Garrett Wedam Cliff Mass Wedam, McMurdie and Mass, 2009: Comparison of Model Forecast Skill of Sea-level Pressure along the East and West Coasts of the United States. Wea. Forecasting, 24, 843-854 . May 27, 2009
Large Short-term forecast errors can still occur despite recent model improvements NCEP NAM 72-h forecasts (white), analyses (black), slp errors (black numbers) valid on 0000 UTC 24 December 2006. NCEP GFS 72-h forecast (cyan) and slp errors (black numbers) valid 1200 UTC 1 January 2009
Goals • Document the frequency and magnitude of sea level pressure forecast errors • Compare the accuracy of several operational (deterministic) numerical model systems • Compare the accuracy of forecasts along the East and West Coasts of the US • Examine preliminary results from the past winter (2008 – 2009)
Methods -- Observations • Used buoys and c-man observations along the east and west coast. • Observed SLP variance was calculated and west and east coast buoys were matched if they had the same 30-day variance – 11 pairs total • For each model and forecast hour, an average error (Coastal Mean Absolute Error, CAE) was calculated for every forecast cycle. These CAE’s were then averaged for each month. • Also calculated the large-error frequency (number of forecasts exceeding a large-error criteria)
Buoys matched by variance Compare results for the ECMWF, CMC-GEM and NCEP GFS and NAM models for three winter seasons: Nov 2005– Mar 2006, Nov 2006 – Mar 2007, Nov 2007 – Mar 2008.
Coastal Mean Absolute Error for all models, forecast hours and both coasts NAM upgrade to WRF-NMM ECMWFhas smaller errors than other models for most months. NAMhas larger errors than other models for most months and forecast hrs.
Coastal Mean Absolute Error for all models, forecast hours and both coasts East Coast errors smaller than West Coast errors for all months and forecast hours
Frequency of Large Errors >3hPa >5hPa >7hPa Same conclusions apply: ECMWF smallest frequency and NAMthe largest frequency of large errors, East Coast smaller frequency of large errors than West Coast for all models and forecast hours.
Have any models shown improvement over the course of the study? Anomaly CAE = 3-season CAE minus individual season CAE NAM ?? ECMWF improved GFS improved West Coast CMCG improved second year
Did the data assimilation upgrade in Dec 2008 improve forecasts of SLP for the NAM? “Background for the first analysis is from the GDAS instead of the previous NDAS” NAM forecast errorsmuchlarger than GFS errors Assimilation upgrade Dec 2008 NAM forecast errors NOT significantly larger than GFS
Summary • The West Coast has larger and more frequent SLP forecast errors than the East Coast. • The NAM consistently underperformed and the ECMWF outperformed all the other models in the study • Preliminary results from this past winter (2008-2009) show that the data assimilation upgrade has improved SLP forecasts for the NAM model