Nomogram Analysis for Post-Test Probability of Tumors and High-Risk Adenomas
20 likes | 131 Vues
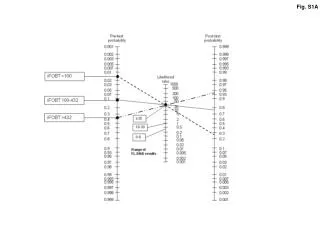
This figure presents the Fagan nomogram analysis, illustrating how to estimate post-test probabilities for patients based on pre-test probabilities and likelihood ratios. A line is drawn from the pre-test probability to a point on the vertical axis corresponding to the likelihood ratio of a test result, represented by various test results. This line intersects the right-hand vertical line to yield the post-test probability, providing a new estimate of the likelihood that a patient has a tumor or high-risk adenoma, enhancing clinical decision-making.

Nomogram Analysis for Post-Test Probability of Tumors and High-Risk Adenomas
E N D
Presentation Transcript
Fig. S1B Figure S1. Fagan Nomogram analysis. A line is drawn connecting the pre-test probability and the point on the middle vertical line corresponding to the likelihood ratio for the test result, represented by a range of test results (boxes). This line is extended to intersect with the right-hand vertical line, which gives the post-test probability. This point is the new estimate of probability that the patient has the disease. A) Nomogram for post-test probability of having a tumour. B) Nomogram for post-test probability of having a tumour or high-risk adenoma.