Download
1 / 21
210 likes | 294 Vues
Explore geology, radiometric dating, and mass extinctions in Earth's history, revealing clues about evolution and biodiversity. Learn about carbon-14 dating, Pangaea, and current biodiversity threats.

E N D
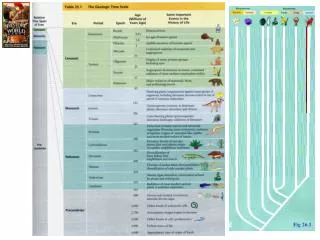
Carbon-14 is produced by cosmic-ray bombardment of the upper atmosphere and decays into N-14. An organism continually replenishes its carbon by breathing and eating. After the organism dies and becomes a fossil, C-14 continues to decay without being replaced. C-14 has a half-life of 5,730 years, and can be used to date young fossils. Fig 25-2. Radiometric dating. Uranium-238 occurs in molten lava and the volcanic rock that forms as the lava cools. After the volcanic rock forms, no more uranium-238 is incorporated, and the rock’s original stock of the isotope decays slowly into lead-206 atoms. Thus, researchers can use the concentration of lead-206 to date volcanic rocks. Sedimentary rocks chronicle the relative ages of fossils; but not the absolute ages of the embedded fossils.
Biogeography of marsupials Fig 25-3. Earth’s crustal plates and plate tectonics. Fig 25-4. The history of continental drift.
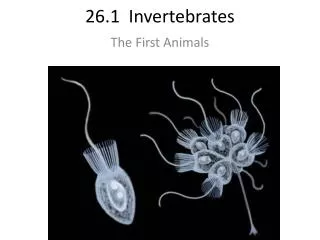
The Cambrian Explosion it was during this time that almost all of the major lifeform types appeared on Earth. Mass Extinction The Cambrian ended with a mass extinction of about 75% of the trilobite families, half the sponge families, and many brachiopods and snails. The cause is not known.
The Permian mass extinction claimed about 90% of the species of marine animals & 8 out of 27 orders of insects. … about the time the continents merged to form Pangaea, which disturbed many marine and terrestrial habitats and altered climate.
The Cretaceous mass extinction of 65 million years ago doomed more than half the marine species and many families of terrestrial plants and animals, including the dinosaurs. … many scientists now favor the so-called impact hypothesis, that the main cause was an asteroid or large comet. Separating Mesozoic from Cenozoic sediments is a thin layer of clay enriched in iridium, an element very rare on Earth but common in meteorites and other extraterrestrial debris. … the Chicxulub crater, a 65-million-year-old scar located on the Yucatén coast of Mexico.
The Current Mass Extinction: Is the biosphere today on the verge of anything like the mass extinctions of the geological past? Increasingly, researchers are doing the numbers, and saying, yes, if present trends continue, a mass extinction is very likely underway. There are about 5,000 known mammalian species alive at present. the background extinction rate for this group is approximately one species lost every 200 years. the past 400 years have seen 89 mammalian extinctions, almost 45 times the predicted rate, and another 169 mammal species are listed as critically endangered.
Linnean systematics is an hierarchical classification scheme. (Kingdom, Phylum, Class Order Family Genus Species) It preceded evolutionary theory and is basically seat-of-the-pants phenetics - what the expert concludes from observed phenotypic similarities. We are still in the midst of the an effort to reconcile the existing taxonomy w/ modern phylogenetic cladistics: an attempt to develop classification (taxonomy) consistent with evolutionary history - decent w/ modification Darwin wrote in The Origin of Species that "our classifications will come to be, as far as they can be so made, genealogies."
http://www.ucmp.berkeley.edu/IB181/VPL/Phylo/Phylo1.html Phenetics … Organisms are grouped according to overall similarity. The results … fail to create groups that reflect evolutionary relationships (Figure 2.2). … because organisms can be similar because they live in similar environments or because they make their living in similar ways, not just because they are descended from a common ancestor.
Likeness attributed to shared ancestry is called homology. The forelimbs of mammals are homologous. Species from different evolutionary branches may come to resemble one another if they have similar ecological roles and natural selection has shaped analogous adaptations. This is called convergent evolution; similarity due to convergence is called analogy. The wings of bats and those of birds are analogous. Fig 25-10. Convergent evolution and analogous structures. As a general rule, the greater the number of homologous parts between two species, the more closely the species are related, and this should be reflected in their classification. This guideline is simpler in principle than it is in practice. Adaptation (convergence) can obscure homologies, and create misleading analogies. Today, most systematists practice what is called cladistic analysis, or simply cladistics. Clades are Monophyletic Groups {1 common ancestor}. A phylogenetic diagram based on cladistics is called a cladogram.
Fig 25-16. The analogy-versus-homology pitfall. The tree in (a) places a bird and a mammal on a clade that excludes the lizard. The tree in (b) recognizes a lizard-bird clade. If we made the mistake of interpreting the four-chambered hearts of birds and mammals as homologous instead of analogous, we might opt for the tree in (a) as our most parsimonious hypothesis.
A key step in cladistic analysis is called outgroup comparison: to differentiate shared characters that are derived from those that are primitive. Outgroup comparison is based on the assumption that homologies present in both the outgroup and the ingroup must be primitive characters that were already present in the ancestor common to both groups.{therefore it is ‘primitive,’ not ‘derived’} Systematists must sort through the homologies to identify the ones that are called shared derived characters. {jargon: synapomorphies} In comparing mammals to other vertebrates, hair is a shared derived character, meaning an evolutionary novelty unique to a particular clade.
http://www.ucmp.berkeley.edu/IB181/VPL/Phylo/Phylo1.html {‘Reptiles’ are NOT a clade!} reptiles Fig 25.18 lizards snakes croc’s birds Organisms that are united by one or more synapomorphies {shared derived characters} share a common ancestor which possessed these derived traits. They belong to a monophyletic group (Figure 2.4; A) in which all descendants of the common ancestor have to be included. This is … a lineage. In modern evolutionary biology, we work hard to recognize only monophyletic groups. If a group does not include all the descendants of a common ancestry, the group is termed paraphyletic (Figure 2.4; B), If the group includes some or all of the descendants, but not the common ancestor, it is called polyphyletic (Figure 2.4; C). Fig 25.11 See C&R Fig 25.9
If homology reflects common ancestry, then comparing the genes and gene products (proteins) of organisms gets right to the heart of their evolutionary relationships. At the molecular level, the evolutionary divergence of species parallels the accumulation of differences in their genomes. The more recently two species have branched from a common ancestor, the more similar their DNA and amino acid sequences should be. Fig 25-13. Aligning segments of DNA. Allows comparison of species too closely related to display much divergence in morphology. {reveals Evolutionarily Significant Units} At the other extreme, makes it possible to trace evolutionary relationships of species so different there is little morphological homology; ex: fungi are more closely related to animals than they are to plants.
In making the sequence comparisons, each base change - say, a point mutation that changes a G to an A – counts as one evolutionary event. Challenged with many such base changes throughout a set of species, a systematist has quite a phylogenetic puzzle to solve. !!!!
Fig 25-17. Dating the origin of HIV-1 M with a molecular clock. The scale on the y axis is a measure of the number of base changes in the gene serving as the molecular clock. Note that during the span of time that the HIV samples were collected from the patients in this data set, … early 1980s and the late 1990s, the gene evolved at a relatively consistent rate. If we project that rate backward in time, we intersect the time axis (x axis) of the graph during the 1930s. The team that published this research concluded that the HIV-1 M strain first infected humans in the 1930s. • Timing the Ancestor of the HIV-1 Pandemic Strains • B. Korberet al. Science Jun 9 2000: 1789-1796. Molecular clocks are based on the observation that at least some regions of genomes evolve at constant rates; the number of nucleotide and amino acid substitutions is proportional to the time that has elapsed since the lineages branched.
Abstract We have examined and dated primate divergences by applying a newly established molecular/paleontological reference, the evolutionary separation between artiodactyls and cetaceans anchored at 60 million years before present (MYBP). … this reference can be defined, paleontologically, According to a homogenous-rate model of {mtDNA} sequence evolution, the primary hominoid divergence, between the families Hylobatidae (gibbons) and Hominidae, was dated at ~36 MYBP. the divergence between Pongo (orangutan) and Gorilla-Pan (chimpanzee) -Homo is ~24.5 MYBP, that for Gorilla vs Homo-Pan is ~18 MYBP, and that for Homo vs Pan ~13.5 MYBP. a (a) b (b) d (d) (c) c Fig. 2. Phylogenetic relationships among hominoids established by NJ amino acid sequence analysis. Pattern and Timing of Evolutionary Divergences Among Hominoids Based on Analyses of Complete mtDNAs Arnason, et al. 1996. J. Mol. Evol. 43, 650.