Download
1 / 2
20 likes | 87 Vues
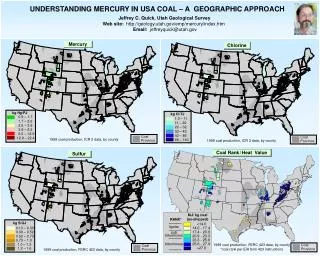
This study explores mercury content in USA coal and its impact on emissions based on geologic age and emission control technology. The significance of coal mercury content is analyzed in connection with power plant technologies. Mercury capture efficiency is influenced by sulfur and chlorine levels in coal. Different power plants exhibit varying mercury capture rates. The study references data from coal assays and power plant emissions.

E N D
kg S/GJ 0.13 – 0.30 0.30 – 0.52 kg Hg/PJ 0.52 – 0.73 0.73 – 1.0 0.9 – 1.7 1.0 – 1.2 1.7 – 2.6 1.2 – 1.6 2.6 – 3.9 3.9 – 6.5 6.5 – 12.9 Coal Province Coal Province Coal Province Coal Province 12.9 – 22.4 kg Cl/TJ 1.3 – 11 11 – 22 22 – 32 32 – 43 43 – 86 86 – 140 UNDERSTANDING MERCURY IN USA COAL – A GEOGRAPHIC APPROACH Jeffrey C. Quick, Utah Geological Survey Web site: http://geology.utah.gov/emp/mercury/index.htm Email: jeffreyquick@utah.gov Mercury Chlorine 1999 coal production, ICR 2 data, by county 1999 coal production, ICR 2 data, by county Coal Rank/Heat Value Sulfur 1999 coal production, FERC 423 data, by county *coal rank per EIA form 423 instructions 1999 coal production, FERC 423 data, by county
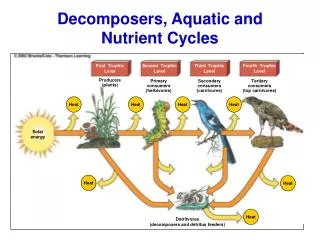
Ceno- zoic Mesozoic Million Years Ago Paleozoic Chlorine increases mercury capture by existing emission control technology. The significance of the coal mercury content depends on the emission control technology at the power plant. Hg emissions out stack (kg/PJ) Hg in coal (kg/PJ) Points show predicted capture for USA county-average, ICR 2 data, modified from Toole O’Neil et al., (2005). Points show different electric power plants, modified from Quick et al., (2005), ICR 3 data. Sulfur reduces mercury capture by existing emission control technology. Chlorine in USA coal varies with rank, but is better explained by geologic age. ASTM rank cold electrostatic precipitator, wet desulphurization [ x ] = %S (dry) cold electrostatic precipitator ( x ) = kg S/GJ Points show USA county-average ICR 2 data, modified from Kolker et al., (in press). Constructed using EPRI and SAIC equations listed by Quick (2006). References ICR 2 (1999) 25,825 coal assays <epa.gov/ttn/atw/combust/utiltox/utoxpg.html> ICR 3 (1999) 240 power plant stack emission measurements <epa.gov/ttn/atw/combust/utiltox/utoxpg.html> FERC 423 (1999) 19,507 coal assays <eia.doe.gov/cneaf/electricity/page/ferc423.html> Kolker, A., Senior, C.L., Quick, J.C., (in press),Mercury in coal and the impact of coal quality on mercury emissions from combustion systems: Applied Geochemistry. Quick, J.C., Tabet, D.E., Wakefield, S., Bon, R.L., 2005, Optimizing technology to reduce mercury and acid gas emissions: DOE contract DE-FG26-03NT41901, <geology.utah.gov/emp/mercury/index.htm> Quick, J.C., 2006, Erratum - Correction to an equation used in . . . : Int. J. Coal Geol., v.66, p.155-156. Toole O’Neil, B., Quick, J.C., Akers, D., 2005, Mercury in US Coal and the US EPA Clean Air Mercury Rule: Oil Gas and Energy Law Intelligence, v. 3, 14 p. <www.gasandoil.com/ogel/> after USGS