Speech and Audio Processing and Coding
Speech and Audio Processing and Coding. Dr Wenwu Wang Centre for Vision Speech and Signal Processing Department of Electronic Engineering w.wang@surrey.ac.uk http://personal.ee.surrey.ac.uk/Personal/W.Wang/teaching.html. 1. Course components. Components Speech Processing

Speech and Audio Processing and Coding
E N D
Presentation Transcript
Speech and Audio Processing and Coding Dr Wenwu Wang Centre for Vision Speech and Signal Processing Department of Electronic Engineering w.wang@surrey.ac.uk http://personal.ee.surrey.ac.uk/Personal/W.Wang/teaching.html 1
Course components • Components • Speech Processing • Wk 1-3, by Wenwu Wang • Speech Coding • Wk 4-6, by Ahmet Kondoz • Audio • Wk 7-8, by Ahmet Kondoz • Wk 9-10, by Wenwu Wang • Assessment • 15% coursework + 85% exam • 6 exam questions with 2 for each of the above component, you only need to do 3 with one from each of the three components • 1 coursework in speech processing 2
Outline of speech analysis • Introduction & applications • Speech production and modelling • Speech perception • Signal processing techniques • Autocorrelation, Fourier transform of speech, spectral properties, convolution, periodicity estimation • Linear prediction and inverse filtering of speech • Transfer function, linear prediction, estimation of linear prediction coefficients, LPC order, inverse filtering, prediction gain • Cepstral deconvolution • Real cepstrum, complex cepstrum, quefrency, pitch estimation via cepstrum, comparison of spectrum envelope obtained by cesptrum with that obtained by LPC 3
Alternative textbooks to speech analysis and audio perception • Digital Processing of Speech Signals, by Lawrence R. Rabiner & Ronald W. Shafer • Signal and Systems, Alan V. Oppenheim, Alan S. Willsky • An Introduction to the Psychology of Hearing, Brian C. J. Moore • Acoustics and Psychoacoustics, David M. Howard, & James Angus 4
Introduction & applications • What is speech & language? • The act of speaking; the natural exercise of the vocal organs; the utterance of words and sentences; oral expression of thought or feeling (Oxford English Dictionary) • The whole body of words and of methods of combination of words used by a nation, people, or race; Words and the methods of combining them for the expression of thought (Oxford English Dictionary) • Didfference: speech is communicated orally (i.e. by mouth); while language consists of rules for combining words together to convey meaning which can be communicated through non-oral mechanisms, such as, written, hand-signals, pictures, Morse code, etc. • Connections: speech is the oral communication of meaningful information through the rules of a specific language. 5
Introduction & applications (cont.) • From the viewpoint of the speech processing/communication engineers • Speech is regarded as a sequence of small speeh-like units, e.g. words or phonemes. • Often the main objective is to enhance, encode, communicate, or recognise these units from real speech or to synthesise them from text. • Our focus here will be on the physical attributes of speech rather than the semantic level, as retrieval of semantic content from speech is a much more difficult and largely unsolved problem. • A speech communication system should generally allow the effective transmission of speech in any language. Whilst rules of language and vocabularies differ greatly, the physical attributes of speech have much more in common between different language. • Transmission of semantic information between speakers assumes huge amounts of prior information. For example, “it’s raining cats and dogs” – talking about weather rather than animals, but not obvious for computers. • We will consider speech as the oral production of sound by natural exercising of the vocal organs, resulting in a sequence of different phonemes or words. 6
Introduction & applications (cont.) • Applications of speech processing • Speech telecommunications and encoding • Preservation of the message content and perceptual quality of the transmitted speech • Minimising the bandwidth required for speech transmission • Speech enhancement • Deals with the restoration of degraded speech caused by, e.g., additive noise, reverberation, echoes, interfering speech or background sounds (cocktail party effect). • Adaptive filtering, spectral subtraction, Wiener filtering, harmonic selection, blind source separation, and computational auditory scene analysis 7
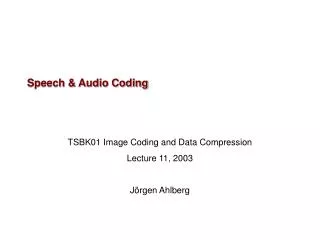
Underdetermined Blind Source Separation Sources: Mixtures: Estimated sources:
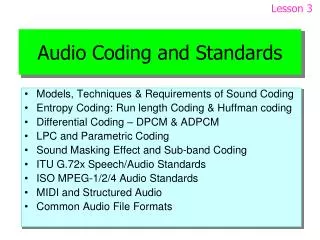
Blind Separation of Reverberant Speech Mixtures with Different Reverberation Time Mixtures RT60=30ms ConvICA Estimated IBM Smoothed IBM Speakers Mixtures RT60=150ms ConvICA Estimated IBM Smoothed IBM Mixtures RT60=400ms ConvICA Estimated IBM Smoothed IBM
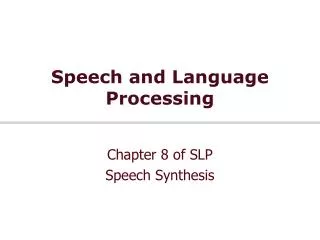
Blind Separation of Real Recordings – Male Speech with TV on Sensor signals Separated source signals Conv. ICA +IBM+Cepstral Smoothing Conv. ICA +IBM Conv. ICA
Introduction & applications (cont.) Applications in speech processing • Speech and speaker recognition • Speech recognition involves the automatic conversion of the message content of the speech signal into a written format. Its performance depends highly on signal quality, speaker identity, language, the size of the word dictionary, etc. • Speaker recognition involves the identification of the speaker based on the statistical properties of the speech signal, which can be thought of as biometric data. • Applications include voice interaction or dictation with computers, speaker verification for security, automated telephony, spoken language translation, etc. linguistic studies, etc. • Speaker diarisation • It studies the question of “who speaks and when”. • It is usually done through speaker segmentation (finding the speaker change point in an audio stream) and speaker clustering (grouping together the segments based on speaker identity or characteristics). 12
Introduction & applications (cont.) • Applications in speech processing • Speech synthesis • It refers to artificial production of speech from text. • Applications include speech-driven interfaces with computers, automated telephony, general announcements in train stations, airports, etc. • Quality measures include naturalness (how much the output sounds like the speech of a real person) and intelligibility (how easily the output can be understood). • Speech analysis • Refers to the analysis of speech, such as waveform and spectrum, for disclosing its more detailed contents. • Applications include user-feedback during language learning, speech therapy, linguistic studies, etc. 13
Linguistics • A note on linguistics • Linguistics is the scientific study of human language. Linguistic structures are pairings of meaning and sound. Various sub-parts of linguistic structure exist which can be arranged hierarchically from sound to meaning (with overlap): • Phonetics: study the sound of human language. • Phonology: study the distinctive units within a given language and commonalities across languages. • Morphology: study the internal structure of words. • Syntax : study of how words are organised into sentences. • Semantics : study meaning of words or sentences. • Pragmatics: study how utterances are used in communicative acts. • Discourse analysis: study how sentences organised into texts. • Phoneme • The smallest units of speech in a language that distinguish one word from another. • Continuous speech can be thought of as a concatenation of different phonemes. Phonemes are split into consonants (either voiced or unvoiced) and vowels (all are voiced) in English. 14
Speech Production • Many problems in speech processing can be aided by a basic understanding of the speech production mechanism and anatomy of the vocal tract. • Common speech coding schemes such as linear predictive coding (LPC) provide a fairly crude model of the speech production process. • More complex physical models of speech production process, e.g. taking into account the precise shape and absorption characteristics of the vocal tract have resulted in more natural sounding speech synthesizers. 15
Speech Production (cont.) • Vocal organs • Vocal tract: begins at the vocal cords or glottis, ends at the lips. • Nasal tract: exists between the velum and the nostrils. • Lungs, diaphragm, and trachea are situated below the vocal cords, serving as an excitation mechanism by directing the air from the lungs through the trachea and the glottis. 16
Speech Production (cont.) Sagittal section of the vocal tract 17
Speech Production (cont.) 18 A sketch of the vocal tract
Speech Production (cont.) • Voiced and unvoiced speech • Voiced speech: the flow of air from the lungs causes a quasi-periodic vibration of the vocal cords (or vocal folds), and the sound transmitted along the vocal tract is unimpeded. • Unvoiced speech: the flow of air through the vocal apparatus is either cut-off or impeded, e.g. by forming a constriction using the tongue or lips. 19
Speech Production (cont.) • Voicing process • Air forced through the glottis results in a quasi-periodic oscillation of the vocal cords, as shown in the left figure. • In stage 2-4, the increasing pressure in the trachea forces the opening of the glottis. • As air travels through the glottis, the air pressure decreases between the vocal cords. • The decreasing pressure forces the vocal cords to snap together again, at the lower edge first, as in stages 6-10. • The resulting perception is called pitch, whose frequency is around 85-155Hz for adult male speakers and 165-255Hz for adult female speakers. 20
Speech Production (cont.) Beth's First Laryngoscopy - Vocal Cords in Action • An interesting video clip from Youtube, available at: • http://www.youtube.com/watch?v=iYpDwhpILkQ 21
Speech Production (cont.) • Unvoiced speech • Unvoiced sounds are caused by a partial or total constriction at some point in the vocal tract, such as the lips. • Air can be forced through this constriction to create turbulence or noise (e.g. fricative sounds \s\ and \f\), or the constriction can be opened suddenly to create a burst of turbulence (e.g. the plosives \p\ and \t\) • There is no vibration of the vocal cords. • The excitation signal can be regarded as a random noise source as opposed to a periodic sequence of glottal pulses in the voiced case. 22
Speech Production (cont.) Typical voiced and unvoiced speech waveform and their spectrum [Sources: from Rice/PROJECTS00/vocode/] 23
Speech Production (cont.) • Formants • The vocal tract (and on occasion, coupled with nasal tract) can be regarded as a resonant system that performs some spectral modification of the excitation signal (i.e. a quasi-periodic series of glottal pulses for voiced sounds, or turbulent air flow/noise for unvoiced sounds) before it is released from the lips. • Modes or peaks in the frequency response of the resonant system are known as formants, and these occur at the formant frequencies. • Anti-resonances (minimum in the frequency response) can also exist, e.g. for nasal consonants. • In speech, the most perceptually important formants are the lowest 3 formants. However, trained singers are sometimes able to place more energy in higher formants (e.g. around 3000Hz for male operatic singers). 24
Speech Production (cont.) The first three formants of "ah" are shown in the above spectrum. The vertical lines denote harmonics due to the vibration of the vocal cords (i.e. multiples of the fundamental frequencies). The vocal tract acts as a resonance system through which harmonics pass to generate the vowel's characteristic spectral shape. 25
Speech Production (cont.) • Vowels • Vowels are all voiced. Vowel phonemes in BBC English is shown below: 26
Speech Production (cont.) • Vowels • Vowels can be characterised by the articulatory parameters as shown in the vowel quadrilateral in the following figure: height (close/mid/open: the vertical position of the tongue relative to the roof of the mouth), backness (front/central/back: horizontal tongue position relative to the back of the mouth), and roundedness (whether the lips are rounded or not). 27
Speech Production (cont.) • Vowels • Vowels can also be characterised in terms of their average formant frequencies, which are related to the articulatory parameters but differ more from speaker to speaker. • The first three formant frequencies are given in the following table for various vowels (averaged over male speakers): 28
Speech Production (cont.) • Consonants • The point or place of constriction in the vocal tract, typically between the tongue and a stationary articulator (e.g. the teeth or the roof of the mouth), gives the consonant its characteristic sound. • Consonants can be categorised into: • Fricatives: produced by forcing air through a narrow channel at some point in the oral pathway. They can be either voiced, e.g. \v\, \z\, or unvoiced, e.g. \f\, \s\. Sibilants is a particular subset of fricatives, where the air is directed over the edge of the teeth, e.g. \s\ and \z\. • Stops: produced by building up pressure behind complete constriction in the vocal tract, and suddenly releasing the pressure, e.g. voiced \b\, \d\ and \g\, and unvoiced \p\, \t\ and \k\. Plosives are reserved for oral (non-nasal) stops, such as \p\ in pit, and \d\ in dog. • Nasals: the mouth is completely constricted at some point, and the velum is lowered so that nasal tract is opened, and sound is radiated from the nostrils, e.g. \m\, \n\. • Affricates can be modelled as a concatenation of a stop and a fricative, e.g. \dzh\. • Approximants: vocal tract is narrowed, but leave enough space for air to flow without much audible turbulence, e.g. \w\ \l\. 29
Speech Production (cont.) • Consonants phonemes in BBC English: 30
Speech Production (cont.) • Vowel, consonant, and formant frequency can be depicted by the right figure: • Waveform and spectrogram of the word “zoo” 31
Modelling of speech production • Accurate model • The production of speech is rather complex, and to model it accurately with a physical model would have to involve the following: • The nature of the glottal excitation, e.g. periodic/aperiodic • Time variation of the vocal tract shape • Losses due to heat conduction, viscous friction and absorption characteristics of the vocal tract walls • Nasal coupling • Radiation of sound from the lips • Reference: • L. R. Rabiner and R.W. Schafer, “Digital Processing of Speech Signal,” Printice-Hall, 1978. 32
Modelling of speech production • Lossless tube model • One of the simplest models of the vocal tract is a tube of non-uniform, time-varying cross-section with plane wave propagation along the axis of the tube, assuming no losses due to viscosity or thermal conduction: 33
Modelling of speech production • Source-filter model • The source or excitation is the signal arriving from the glottis, either a quasi-periodicsequence of glottal pulses or a broad-band noise signal (typically treated as Gaussian noise). • The combined response of the vocal tract, nasal tract, and lips is modelled as a time-varying linear filter. • The output of the model is a convolution of the excitation with the impulse response of the linear filter. The filter response typically has a number of poles and zeros, or may be an all-pole filter as in LPC. • It is an approximation and is widely used in speech coding for its simplicity. Filter parameters can be estimated easily from real speech, which can be subsequently used for speech synthesis using the same source-filter model in the receiver end of the transmission channel. 34
Modelling of speech production Magnitude in dB FFT size Model fit to the real data (where PDS denotes the power spectral density function) [Sources: from Rice/PROJECTS00/vocode/] 35
Speech perception • The auditory system and subsequent higher-level cognitive processing, is responsible for speech perception. It has an entirely different structure to the organs of speech production, and is not at all like an inverse model of speech production. • The study of auditory system is split into physiological aspects (i.e. relating to physical/mechanical processing of sound) and psychological aspects (i.e. related to processing in the brain). • Psychoacoustics is a general term for the study of how humans perceive sound, covering both physiological and psychological aspects (to be covered in wk 9-10). 36
Speech perception (cont.) • Outer ear • It contains pinna and auditory canal. The pinna helps to direct sound into the auditory canal, and is used to localise the direction of a sound source. The sound travelling through the canal causes the tympanic membrane (eardrum) to vibrate. • Middle ear • It contains three bones (or ossicles): the malleus (or hammer), incus (or anvil) and stapes (or stirrup). The arrangement of these bones amplifies the sound being transmitted to the fluid-filled cochlea in the inner ear. • Since the surface area of the eardrum is many times of that of the stapes footplate, sound energy striking the eardrum is concentrated on the smaller footplate. The angles between the ossicles are such that a greater force is applied to the cochlea than that transmitted to the hammer. The middle ear can also be considered as an impedance matching device. • Inner ear • It contains two sensory systems: the vestibular apparatus, and the cochlea. The former is responsible for balance and contains the vestibule and semi-circular canals. Sound transmitted to the inner ear causes movement of fluid within the cochlea. The hair cells within the cochlea are stimulated by this movement and convert the vibration into electrical potentials, which are then transmitted as neural impulses along the auditory nerve towards the brain. 37
Speech perception (cont.) 38 Anatomy of the human ear
Speech perception (cont.) • Hair cells along the cochlear are frequency-selective, with hair cells at the end near the elliptical window being receptive to high frequencies, and those near the apex being receptive to low frequencies. • It performs a kind of spectral analysis, whose resolution is non-linear. In other words, a difference of Δf = 10Hz between two sinusoidal components around 100Hz is easily noticeable, whereas at 5kHz is imperceptible. • The frequency sensitivity of the cochlea is roughly logarithmic above around 500Hz, i.e. the relative frequency resolution Δf/f of the cochlear is relatively constant. • As a consequence of the non-linearity of the frequency selectivity of the ear, the mel-frequency scale was designed as a perceptual scale of pitches judged by listeners to be equal in distance from one another. In other words, any three frequencies equi-distant apart in mels, will appear to be roughly equi-distant in perceived pitch. 39
Speech perception (cont.) • Cognitive processing of sound is still an active area of research with many questions to be answered. • The study of how humans process and interpret their sound environment is termed as auditory scene analysis. • Computer simulation of the auditory scene analysis process is known as computational auditory scene analysis. 40
Speech perception (cont.) • To convert frequency in Hz into mel, we use: • And vice versa: 41
Speech perception (cont.) Mel-frequency scale 42
Speech perception (cont.) • Sensation of loudness is also frequency-dependent. • When listening to two equal amplitude sinusoids/pure tones at 50Hz and 1kHz, the 1kHz sinusoid will be heard as louder. • The range of hearing is roughly between 20Hz and 20kHz (although these limits tend to reduce with age, especially at the high-frequency end). Outside these limits, nothing is heard at all. • The unit of measurement of loudness level is phon; by definition, two sine waves that have equal phons are equally loud. 43
Digital encoding of speech • Processing of speech has moved almost entirely into the digital domain. • Speech is initially a variation in air pressure which is converted into a continuous voltage by a microphone. • Digital encoding of speech has several advantages, such as: • Digital signals can be stored for periods of time and transmitted over noisy channels relatively uncorrupted. • Digital signals can be encrypted by scrambling the bits, which are then unscrambled at the receiver. • Digital speech can be encoded and compressed for efficient transmission and storage. 45
Analog-to-digital (A/D) conversion • A/D conversion consists of two stages: • Sampling • A continuous signal x(t) can be sampled into a discrete signal x[n] =x(nT), every T seconds, using a sample and hold circuit. The sampling rate is defined as the number of samples obtained in one second, and is measured in Hertz (Hz), i.e. • Quantisation • The value of each sample is represented using a finite number of bits. Each possible combination of n bits denotes a quantisation level. The difference between the sampled value and the quantised value is the quantisation error. 46
A/D conversion (cont.) • In practice, different bit-depth usually used for different audio signals • Digital speech • The dynamic range of clean speech is around 40dB (between the threshold of hearing and the loudest normal speech sound). Background noise becomes obtrusive when SNR is worse than about 30dB. Therefore, a 70dB dynamic range provides reasonable quality, which is equivalent to 12-bit resolution (roughly 6dB/bit). • Commercial CD quality music • 16 bits are usually used, i.e. 65536 levels, which correspond to 96dB dynamic range. • Digital mixing consoles, music effects units, and audio processing software • It is common to use 24-bits or higher. 47
A/D conversion (cont.) • Reconstruction conditions • Aliasing effect and Nyquist criterion • To allow the perfect reconstruction of the original signal, the sampling rate should be at least twice the highest frequency in the signal. • A lower sampling rate can cause aliasing effect. 48
Anti-aliasing • To avoid aliasing effect, the A/D converter usually incorporates an anti-aliasing filter (a low-pass filter) before sampling, with a cut-off frequency near the Nyquist frequency (half of the sampling rate). • In practice, it is difficult to design a steep cut-off low-pass filter. A non-ideal filter is used instead, and the sampling rate is usually chosen to be more than twice the highest frequency in the signal. For some typical applications, the sampling rates are usually chosen as follows: • In telecommunication networks, 8kHz (the signal is band-limited to [300 3400]Hz) • Wideband speech coding, 16kHz (natural quality speech is band-limited to [50 7000]Hz) • Commercial CD music, 44.1kHz (audible frequency range reaches up to 20kHz) • Oversampling can be advantageous in some applications to relax the sharp cut-off frequency requirements for anti-aliasing filters. 50


![[Advanced] Speech & Audio Signal Processing](https://cdn2.slideserve.com/3915760/advanced-speech-audio-signal-processing-dt.jpg)