Download
1 / 15
150 likes | 382 Vues
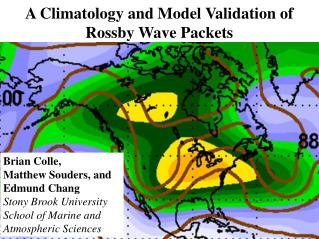
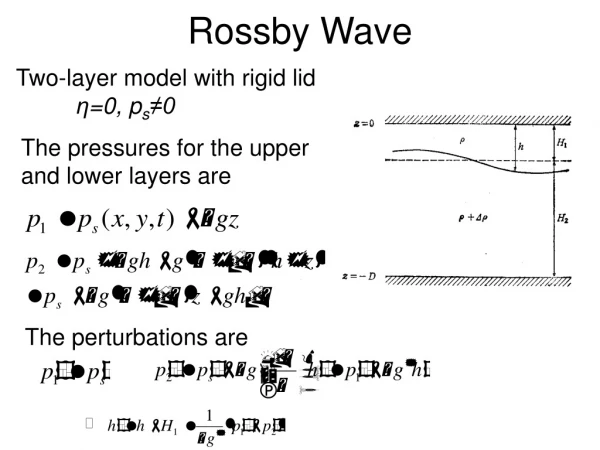
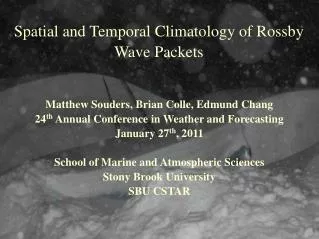
Spatial and Temporal Climatology of Rossby Wave Packets. Matthew Souders, Brian Colle, Edmund Chang 24 th Annual Conference in Weather and Forecasting January 27 th , 2011 School of Marine and Atmospheric Sciences Stony Brook University SBU CSTAR. Rossby Wave Packets: Overview.

E N D
Spatial and Temporal Climatology of Rossby Wave Packets Matthew Souders, Brian Colle, Edmund Chang 24th Annual Conference in Weather and Forecasting January 27th, 2011 School of Marine and Atmospheric Sciences Stony Brook University SBU CSTAR
Rossby Wave Packets: Overview Hovmoller Diagram: 300 hPa Meridional Wind (left) and Wave Packet Envelope Amplitude (right) for March 2, 2009 NYC Snow Event Phase Group
Motivation & Goals • Wave packets linked with weather disasters, regime changes (e.g. Archambault et al. 2009) and predictability issues (Majumdar et al., 2010) • Need to better understand spatial and temporal distribution of wave packets (no robust climatology to date) • Goals: develop a wave packet tracking method, and use it to produce a climatology. March 2, 2009 – New York City life.com
Extracting Wave Packet Envelopes • Implemented the Hilbert transform stream flow technique described by Zimin et al. (2006) using 300 hPa meridional wind to extract wave packet envelope amplitude (WPA) • NCEP/NCAR global 2.5 degree reanalysis (1948-2009) • 14-day running mean 300 hPa wind used to establish the stream flow along which packets propagate
Object-based Wave Packet Tracking • Relative maxima in wave packet amplitude (WPA) used to track wave packets • Raw WPA spectrally filtered (Cholesky Decomposition – e.g. Wilks, 2006) at T21 resolution to reduce noise • Used TRACK program (Hodges, 2009) to obtain cost optimization of user specified maximum displacement and smoothness parameters • Verification over three months (JAN-MAR, 2009), using ageostrophic geopotential flux divergence (AGFD) (fromChang, 2000 – eq. 2) • Probability of significant packet detection: ~98% (2366 points) • False alarm rate: ~8% (74 tracked packets, 6 of them likely not significant)
Merging Related Tracks • WPA maxes often split when encountering obstacles (split flows, wave breaks, mountain barrier crossings) – this may cause TRACK to assign multiple track IDs to one wave packet. • Tracks related by spatial and temporal proximity were merged if both tracks shared a common WPA object • Manual verification produced ~85% agreement on the formation and dissipation dates of significant wave packets X X Common WPA Object (Max WPA * 0.7)
Long Durating Wave Packet Track and AGFD (JAN 29-FEB 27, 2009)
Spatial Climatology of Wave Packet Activity Intensity Volume for the entire reanalysis period (in m s-1): Derived by summing the WPA values for each feature returned by track within five degree bins based on the latitude and longitude of each feature.
AUG • Monthly Average WPA Intensity Volume (5-deg bins) • Summer to Fall Transition: • Rapid Increase from Aug to Sept over C. Pac and NW Atlantic, peaking in October • Maxima shift SE toward PacNW and SW toward Eastern North America m s-1 SEP OCT NOV
NOV • Monthly Average WPA Intensity Volume (5-deg bins) • Fall to Winter Transition • Pacific activity moves east toward CONUS and weakens. • Atlantic peaks in December and moves S and then E • Packets pass N of Tibet in fall, S in midwinter m s-1 DEC JAN FEB
MAR • Monthly Average WPA Intensity Volume (5-deg bins) • Winter to spring transition • Atlantic activity decreases steadily through the spring and lifts north toward Newfoundland • Central Pacific experiences second wave packet activity peak in May • Most activity ends by June m s-1 APR MAY JUN
Northern Hemisphere Winter ENSO Signals Multivariate ENSO Index (Wolter, 1987) > 0.5 (El Nino) and < -0.5 (La Nina) El Nino More subtropical activity La Nina Increased amplitude in storm track belts
Concluding Remarks • An objective, object-based algorithm for tracking and analysis of wave packets has been successfully tested on reanalysis data. • Wave packets are most active (and intense) in the known mid-latitude storm track belts (East of Southern tip of Africa and in the North Pacific and Atlantic basins) along both 45 N and 45 S (as expected by Blackmon, 1977). • N. Atlantic activity peaks between October and December, moving SW from the N Atlantic to over Eastern CONUS during midwinter and back to the NE by the late spring. • Over the N. Pacific, activity drops during the midwinter months compared to October or May. The center of action varies from the central Pacific in the spring and fall to near CONUS during DJF • During La Nina there is increased pattern amplitude over N. America and S of Tibet while El Ninos favor more activity in the subtropical Pacific and fewer packets over North America (consistent with Seager et al. 2010)
Future Work • A robust, long-period wave packet climatology makes model verification with a multi-model ensemble (TIGGE) possible – do global models produce medium range forecasts for wave packets that agree with observations? • Wave packets may be linked with regime changes (periods often associated with reduced model forecast skill) – a wave packet tracking database opens up study on the interaction between wave packets and flow regimes (e.g. Feldstein and Dayan, 2008).
Spatial and Temporal Climatology of Rossby Wave Packets Thank you! Questions??