Download
1 / 10
170 likes | 524 Vues
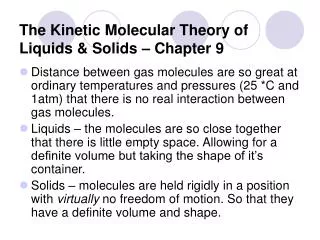
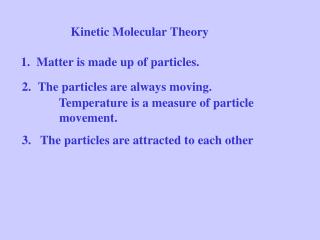
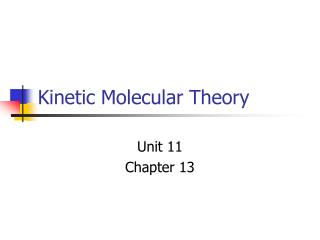
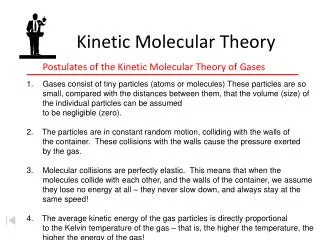
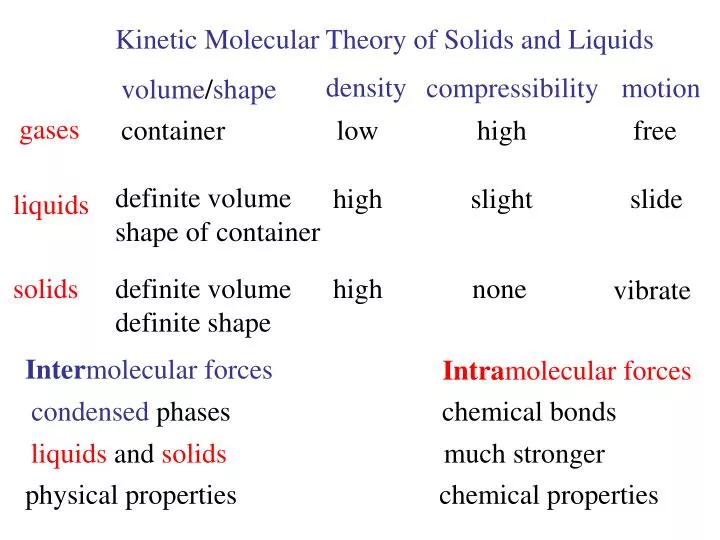
Kinetic Molecular Theory of Solids and Liquids. density. compressibility. motion. volume / shape. gases. container. low. high. free. definite volume shape of container. high. slight. slide. liquids. solids. definite volume definite shape. high. none. vibrate.

E N D
Kinetic Molecular Theory of Solids and Liquids density compressibility motion volume/shape gases container low high free definite volume shape of container high slight slide liquids solids definite volume definite shape high none vibrate Intermolecular forces Intramolecular forces condensed phases chemical bonds liquids and solids much stronger physical properties chemical properties
Changes of State exothermic endothermic gas Hvap vaporization condensation sublimation deposition liquid Hfus freezing melting solid
Phase changes Liquid-Vapor Equilibrium liquid evaporation gas depends on T liquid condensation gas depends on [vapor]
vapor pressure = 1 atm boiling point PT1 = H 1 - 1 ln PT2 R T2 T1 H = heat of vaporizaton
Phase changes liquid gas 1 atm Boiling Point vaporization within the liquid vapor pressure in bubble = external pressure fluid bubble 1 atm Tb = 1 atm normal boiling point lower P lower boiling point raise boiling point raise P critical T 218 atm critical P 374oC
Phase changes gas liquid Condensation decrease T increase P decrease K.E. decrease distance critical T (Tc) gas phase can not be liquified highest T at which a liquid can exist fluids above Tc critical P (Pc) minimum P which will liquify gas at Tc CO2 31oC critical T = critical P = 73 atm at > 73 atm supercritical fluid decaffeinate coffee IMF independent of T finite strength
Phase changes Liquid-Solid Equilibrium liquid solid smaller V larger V fusion (melting) freezing molecules move past each other solids - molecules vibrate around average positions liquids - Tf = 1 atm normal freezing point > < raise freezing point raise P Vl Vs = water > < raise P lower freezing point Vwater Vice =
Heating Curve 100 60 T (oC) C (J/oC) x 20 0 -20 heat T (oC) (J/oC) x C 1 mole of H2O Tf - Ti Cice = 37.6 J/moloC T (oC) heat (J) = C (J/oC) x = 37.6 x 0 - (-20) = 752 J ( )oC Hfus = 6.01 kJ/mol = 6010 J heat (J) = Cwater = 75.3 J/moloC gas heat (J) = solid liquid = 75.3 x 100 - (0) = 7530 J ( )oC . Hvap = 40.67 kJ/mol = 40670 J heat (J) = Csteam = 33.1 J/moloC heat (J) = = .102 x ( )oC 120-100 = 662 J
Phase Diagram P 1 atm solid liquid gas 273 K 373 K T = normal melting and boiling points = “triple point” of water (0.0098oC, 0.006 atm) = critical point of water (647 K, 218 atm)
T time P 0.006 0.01 T Phase Diagram D C B A H2O CO2 73 218 liquid A B C D 1.0 liquid P solid solid 5.1 gas 1.0 gas -78.5 -56.6 0.00 100 374 31.1 T