Enhancing IPEDS Tools: Understanding User Needs and Recommendations for Improvement
140 likes | 251 Vues
This presentation discusses the findings from a study conducted on the needs of IPEDS data users, particularly novices and non-IR professionals. It explores the effectiveness of current IPEDS online tools and identifies necessary improvements. Methods included unstructured interviews, tool reviews, and web server log analysis. Key recommendations include simplifying data retrieval processes, enhancing navigation, and creating user-specific features. The study concludes that while IPEDS tools are rich in features, there is significant opportunity for improvements to meet diverse user needs effectively.

Enhancing IPEDS Tools: Understanding User Needs and Recommendations for Improvement
E N D
Presentation Transcript
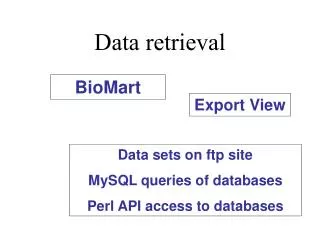
IPEDS Data Retrieval Center Design SHEEO PresentationApril 17, 2008
Project questions & Methods Questions • What are the needs of IPEDS data users, especially novices and those outside the traditional institutional research (IR) community? • How well are the current IPEDS online tools meeting those needs? • What additional tools or features of current tools are needed for a complete suite of tools and IPEDS Data Center? Methods • Unstructured interviews/focus groups • Extensive review of current tools including flow and functions • Review of tools in comparison to other available tools • Documentation of different audiences for tools • Analysis of web server logs
Server log analysis – cont. • Only 2007 data available, w/ no discernible trend across months • Almost 10K users of the IPEDS tools each month • Peak use in February, slight decline in May • DAS gets little attention w/ 228 average users per month. Slightly more than half of all traffic is to the PAS (4,848), followed by the DCT (2,600) and the ExPT (1,666) • Only half of users (54.3%) get to the point of creating a product, with DAS 25.9%, ExPT 33.6%, PAS 56.3%, and DCT 76.7%
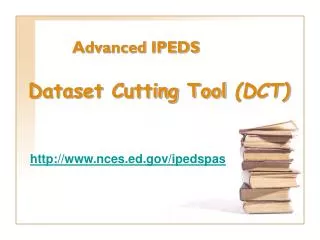
Types of tools • Data comparison tools (17, including 5 at ED) IPEDS DCTIPEDS PASIPEDS ExPTNCES Compare Public LibrariesNCES Compare Academic Libraries • Institution Finder/Profile tools (27, including 8 at ED) NCES College NavigatorIPEDS COOLOPE Campus Security StatisticsEquity in AthleticsNCES Public School District SearchNCES Public & Private School SearchNCES Public Library SearchNCES Search for Schools, Colleges & Libraries • Table Generator tools (12, including 2 at ED) DASOLNCES State Education Data Profiles
Types of tools • The 54 tools included 112 different features & 85 sub-features • The availability of features varies with the tools • Common basic features include: - viewing results online in HTML format (52 tools) - providing contact information (51) - selecting schools based on criteria (41) - presenting search results (39) • Evolution of the tools is still at an early stage, subject to the vagaries of funding & organizations’ unique vision for data sharing • While there are models to follow, these are more in the use of specific features, such as crosstabs, dynamic reports, & widgets
Study conclusions • IPEDS data are being used more than ever & in a wide range of publication types • IPEDS is viewed as an important source of data for dissertations & peer-refereed journals • The IPEDS tools are rich in features & meet a variety of needs • Many models exist for how to share data, but none are any more compelling than those of IPEDS, which are as good if not better than other available tools
Key study recommendations • Improve the time it takes to retrieve data • Improve displays • Facilitate simple requests • Simplify the process to decrease abandonment • Break apart the tools into features that could function individually, with interoperability • Step-by-step process • Integrate data from other sources • Provide different levels of aggregation, with drill-down capability • Provide a single login that works across all four tools
Key study recommendations cont. • Include a set of unique audience pages • Create a “My IPEDS” page • Convert all of the tools to .NET & make more use of widgets • Modernize and increase navigation capabilities, with a clear “road map” • Create a “Report Wizard” • Incorporate web-based, dynamic, data-driven reports • Allow three types of access: (1) final data; (2) preliminary data; and (3) collection level • Keep all user IDs, passwords, peer comparison groups, master variable lists, & table parameter files online, stored in a special NCES database table which allows users to manage & share these files
Recommendations–other features • Alpha browse of school names • Select/de-select institutions by type (Title IV, tribal, & other school types) • Automatically incorporate allocated parent/child data • Provide additional selection typologies • Toggle back & forth between yearly & trend data sector, control, level, Carnegie classifications, state, location, etc. • Provide more single-record and merged data • Make qualifying and categorical variables easier to use • Clarify & simplify key data • Increase training for all levels of users, especially for analysis • Acquire needs data from audience groups
User-specific recommendations Diverse Users • Make the tools question-driven • Don’t make the user learn all about IPEDS just to get the data • Provide lists of schools compiled using different selection criteria • Provide reports and datasets related to specific research/ policy analysis topics • New Users • Include help manuals that are searchable & printable, including material written especially for new users, audience-specific manuals, a glossary of terms, and contextual help • Explain confidentiality and perturbation • Tell new users what is not in IPEDS