Download

1 / 22
230 likes | 600 Vues
Physiology of the Cardiovascular System Electrical Conduction in the Heart. Anatomy & Physiology K 2014. Contractile Cells . 99 percent of all cardiac muscle cells Action potential of contractile cells similar to skeletal muscle, but has longer duration

E N D
Physiology of the Cardiovascular SystemElectrical Conduction in the Heart Anatomy & Physiology K 2014
Contractile Cells • 99 percent of all cardiac muscle cells • Action potential of contractile cells similar to skeletal muscle, but has longer duration • Rapid depolarization due to sodium ion influx • The plateau mostly due to sodium pumping out and calcium influx • Repolarization due to potassium efflux
Contractile Cells • Skeletal muscle action potential lasts 10 msec • Cardiac contractile cell AP lasts 250–300 msec • Until membrane repolarizes it cannot respond to another stimulus • This extends the refractory period • Limits the number of contractions per minute • Makes tetanus impossible
Figure 12-8a Action Potentials and Muscle Cell Contraction in Skeletal and Cardiac Muscle. Rapid Depolarization Repolarization The Plateau Cause: K+ loss Duration: 75 msec Ends with: Closure of potassium channels Cause: Ca2+ entry Duration: ~175 msec Ends with: Closure of calcium channels Cause: Na+ entry Duration: 3–5 msec Ends with: Closure of voltage-gated sodium channels +30 0 mV Refractory period –90 100 200 300 0 Stimulus Time (msec)
Figure 12-8b Action Potentials and Muscle Cell Contraction in Skeletal and Cardiac Muscle. +30 SKELETAL MUSCLE Action potential 0 mV –85 Tension Contraction 0 100 200 300 Time (msec) +30 CARDIAC MUSCLE 0 Action potential mV –90 Tension Contraction 0 100 200 300 Time (msec) Action potentials and twitch contractions in a skeletal muscle (above) and cardiac muscle (below). The shaded areas indicate the duration of the refractory periods.
The previous slides were just comparing the differences in muscle physiology between cardiac muscle tissue and skeletal muscle tissue. If it helps your notes… create a T-chart with a side by side comparison!
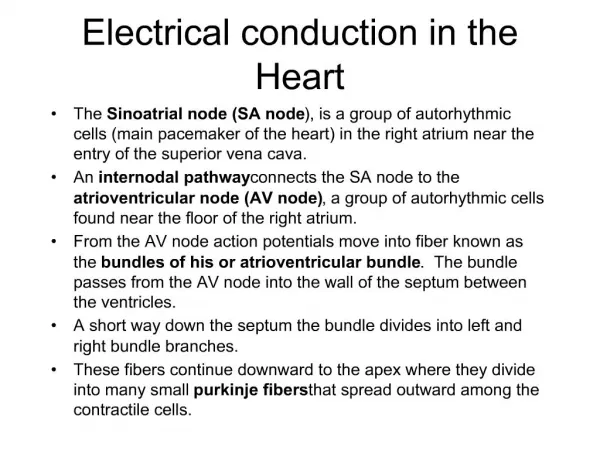
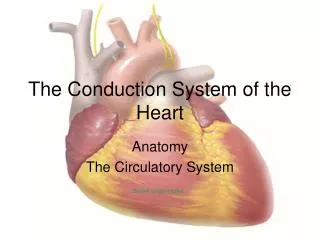
The Conducting System • Allows for automaticity or autorhythmicity • Cardiac muscles contract without neural input • Nodal cells initiate rate of contraction • Sinoatrial(SA) and atrioventricular(AV) nodes • Conducting cells distribute stimuli to myocardium • AV bundle(bundle of His), right and left bundle branches, and Purkinje fibers
The Conducting System • Pacemaker cells • Are nodal cells that reach threshold and fire first • SA node • In posterior right atrium is cardiac pacemaker • Signal distributed so both atria contract together first then both ventricles contract together at 70–80 bpm • Atria contract from top down • Ventricles contract from bottom up • If SA node fails, AV node takes over at 40–60 bpm
The Conducting System • Signal from SA node is delayed at AV node • Ensures atria contract before ventricles • Clinical problems with pacemaker activity • Bradycardia is rate slower than 60 bpm • Tachycardia is rate faster than 100 bpm • Ectopic pacemaker when abnormal cells generate abnormal signals PLAY ANIMATIONThe Heart: Conduction System (use video file)
Conduction system tutorials • McGraw Hill – Cardiac Conduction • Khan academy – Heart Conduction
Heart Contractions • Homeostatic imbalance • Heart block—damaged AV node releases them from control of the SA node; result is in a slower heart rate as ventricles contract at their own rate • Ischemia—lack of adequate oxygen supply to heart muscle • Fibrillation—a rapid, uncoordinated shuddering of the heart muscle
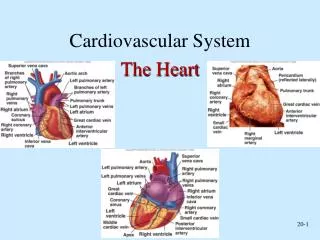
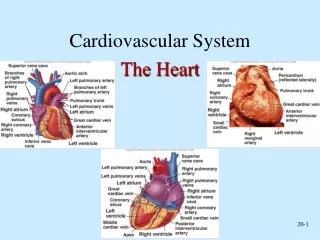
Sinoatrial (SA) node Figure 12-9a The Conducting System of the Heart. Atrioventricular (AV) node AV bundle Internodal pathways Bundle branches Purkinje fibers Components of the conducting system.
Superior vena cava Sinoatrial (SA) node (pacemaker) Left atrium Atrioventricular (AV) node Atrioventricular (AV) bundle (bundle of His) Right atrium Bundle branches Purkinje fibers Interventricular septum Purkinje fibers Figure 11.7
Figure 12-9b The Conducting System of the Heart. SA node activity and atrial activation begin. SA node Time = 0 Stimulus spreads across the atrial surfaces and reaches the AV node. AV node Elapsed time = 50 msec There is a 100-msec delay at the AV node. Atrial contraction begins. AV bundle Bundle branches Elapsed time = 150 msec The impulse travels along the interventricular septum within the AV bundle and the bundle branches to the Purkinje fibers. Elapsed time = 175 msec The impulse is distributed by Purkinje fibers and relayed throughout the ventricular myocardium. Atrial contraction is completed, and ventricular contraction begins. Purkinje fibers Elapsed time = 225 msec
The Electrocardiogram • ECG or EKG • Electrical events of the heart travel through body • Can be monitored with electrodes for diagnosis of cardiac arrhythmias, abnormal cardiac activity • P wave indicates atrial depolarization • QRS complex indicates ventricular depolarization and "hidden" atrial repolarization • T wave indicates ventricular repolarization
The Electrocardiogram • Times between waves are segments, intervals include a segment and at least one wave • P–R interval occurs while impulse is traveling from SA node to AV node • P–R interval longer than 200 msec indicates damage to AV node • Q–T interval indicates time required for ventricular depolarization and repolarization
Figure 12-10 An Electrocardiogram. 800 msec +1 Millivolts 0 ECG rhythm strip Electrode placement for recording a standard ECG. The small P wave accom- panies the depolarization of the atria. The impulse spreads across atria, triggering atrial contrac- tions. The QRS complex appears as the ventricles depolarize. The ventricles begin contracting shortly after the peak of the R wave. The smaller T wave coincides with ventricular repolariz- ation. ECG – Heart Contraction Video Tutorial (click here) R An ECG printout is a strip of graph paper containing a record of the electrical events monitored by the electrodes. The placement of electrodes on the body surface affects the size and shape of the waves recorded. The example is a normal ECG; this enlarged section at right indicates the major components of the ECG and the measurements most often taken during clinical analysis. T P Q S P–R interval Q–T interval
Checkpoint • How does the fact that cardiac muscle does not undergo tetanus (as skeletal muscle does) affect the functioning of the heart? • If the cells of the SA node were not functioning, how would the heart rate be affected? • Why is it important for the impulses from the atria to be delayed at the AV node before passing into the ventricles? • What might cause an increase in the size of the QRS complex in an electrocardiogram?
Cardiac Arrhythmias (12.13) • Abnormal patterns of electrical activity in heart • Premature atrial contractions (PACs) • May see in healthy person • Increased with stress, caffeine, some drugs that increase membrane permeability of SA pacemakers • Paroxysmal atrial tachycardia (PAT) • Flurry of atrial activity triggered by PAC • Ventricles keep pace, increasing heart rate to 180 bpm • Atrial fibrillation (AF) • Impulse moving at perhaps 500 bpm produces quivering atrial wall • Ventricular rate may remain normal, so condition may go unnoticed
Ventricular Cardiac Arrhythmias • Premature ventricular contractions (PVCs) • Premature contraction of ventricles • Cell triggering contraction called ectopic pacemaker • Single PVCs common and not dangerous • Increased frequency with epinephrine, caffeine, ionic changes that depolarize cell membranes • Ventricular tachycardia (VT or V-tach) • Four or more PVCs without intervening normal beats • Serious cardiac problem • Ventricular fibrillation (VF) responsible for cardiac arrest • Rapidly fatal as ventricles are quivering and not pumping
Normal ECG Cardiac arrhythmias P T P T P T Premature Atrial Contractions (PACs) P P P Paroxysmal Atrial Tachycardia (PAT) P P P P P P Atrial Fibrillation (AF) Premature Ventricular Contractions (PVCs) P T P T P T Ventricular Tachycardia (VT) P Ventricular Fibrillation (VF) Figure 12.13 1
Module Review • Define cardiac arrhythmias. • Why is ventricular fibrillation fatal? • Which condition is characterized by premature atrial contraction that triggers a flurry of atrial activity?