Download
1 / 40
420 likes | 558 Vues
Building the database, monitoring, and information-sharing system for the Action Platform March 2013. Table of contents. I. Results Monitoring System Key indicators for value chain and input companies with ICT Key indicators for input companies without ICT

E N D
Building the database, monitoring, and information-sharing system for the Action Platform March 2013
Table of contents • I. Results Monitoring System • Key indicators for value chain and input companies with ICT • Key indicators for input companies without ICT • Key indicators for financial institutions • II. ICT Providers for Results Monitoring • FrontalRain • CropIn • Nokia Life • III. Using ICT to Monitor Results—Godrej Agrovet 2
Executive summary • We have worked to create a results monitoring system for company initiatives, collaborations and PPPs for the Action Platform to Create Shared Value in Agribusiness. • First section • The first section of this report outlines potential indicators on farmer characteristics, company inputs and farmer outcomes for three sets of companies: • Value chain and input companies which are using ICT systems to monitor participating farmers, company inputs, and farmer outcomes. • Companies which are not using ICT systems to track farmers served, inputs provided and results achieved. • Financial institutions which are doing appraisal based lending of farmers, with the ability to capture key indicators on farmer clients, financial services provided and changes in farmer incomes. 3
Executive summary • Second section • The second section of this report provides a description of three service providers which offer ICT solutions, with mobile devices for use by field staff and farmers to track farmer tag variables, inputs and outcome: • FrontalRain • CropIn • Nokia Life. • The features of the ICT offerings of each of these firms have been analyzed by an IIMA team, and the firms have reviewed the features described in this report. • We hope that companies will be able to use these ICT offerings for commercial purposes, to track efficiency and effectiveness of operations with large numbers of farmers. The same system can be used to monitor actions taken to meet the shared objectives of the Action Platform to create shared value with 20 million farmers by 2020. • We look forward to the review of the results monitoring system with participating companies to enable implementation in FY2013-14. 4
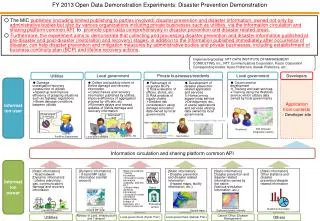
The monitoring system has been designed for input companies, value chain companies and financial institutions with farmer tag indicators, input and outcome indicators, collection methods for each
Key indicators for value chain and input companies with ICT: • Tag indicators on farmers • Input indicators • Outcome indicators 7
Tag indicators on farmers for value chain and input companies with ICT
Input indicators for value chain and input companies with ICT
Outcome indicators for input companies with ICT and value chain companies
Key indicators for input companies without ICT: • Estimates on farmer segments • Estimates on services provided • Estimates on results achieved at farmer level 12
Tag indicators on farmers for input companies without ICT—based upon management estimates using data from agro-dealers and field officers
Input indicators for input companies without ICT, using aggregated estimates by management using data from agro-dealers and field officers
Outcome indicators for input companies without ICT—estimating pre and post engagement outcomes for farmers using management estimates based on information from agro-dealers and field officers
Key indicators for financial institutions: • Tag indicators on farmers • Input indicators • Outcome indicators 16
Tag indicators on farmers for financial institutions—Using information from loan appraisals entered into MIS
Input indicators for financial institutions—Services to farmer by FI, using and refining MIS
Outcome indicators by financial institutions—Impact on net income, end use, repayment and repeat loans
FrontalRain 21
Frontal Rain process map for collecting and providing data for key players in the value chain 22
Target clients, technology and key features of FrontalRain 24
Key agribusiness clients, geographical and sector focus, services, and technology of Frontal Rain 26
CropIn 28
Process map for CropIn system to collect data and provide information to agribusinesses and farmers Area Audit Farmer/Farm Registration Crop Monitoring Export: Trace Consignment Pest Consulting Weighbridge receiving E-Shipment with harvest details Procurement & Farmer Rating 29
Key agribusiness clients, geographical and sector focus, services, and technology of CropIn 33
Nokia Life 34
Nokia Life for FarmersMobile based information and advice covering the entire crop cycle 35
Nokia Life for FarmersStrong agro capabilities, outreach and collaborations. Information to farmers focusing on improving productivity and negotiating power Extensive coverage: 22 states with 7000 markets, 8,000 blocks, 275 crops and commodities 30+ ecosystem partners contributing to sustainable and credible content platform Collaborations with industry on joint projects including NABARD, Syngenta and TAFE 40+ agriculture experts and dedicated Agri Knowledge Desk to validate and enhance inputs to farmers Benefits to the farmers 36
Nokia Life for Agri-EnterprisesEnd-to-end mobile based solution for extension service management for agri-businesses (Inputs, Value-chain and Financial Institutions) to manage programs with farmers • Nokia Life for Agri-enterprises is a single pre-loaded application on Nokia devices to send real-time information updates to field staff and also receive data on daily extension activities • Hyper-local • Personalized • Multi-modal: SMS, voice, data • Seeds • Fertilizers • Farm machinery Inputs Information services for field teams Farmers Field teams Best practices • Water management • Disease management Data gathering from field teams Nokia Life for Agri-Enterprises • Finance and insurance • Contract farming • Livestock for secondary income Yield and income • Flexible data and Image upload support • GPS for geo-locating field activities • Centralized activity monitoring 37
Godrej Agrovet has been a leader in using ICT to monitor productivity enhancing measures and results in its palm oil business, using handheld devises and storing data on a common server. • Godrej Agrovet works with about 36,000 small farmers in palm oil, with over 40,000 hectares, under long term contract with the government. • Godrej Agrovet has been successful in getting high levels of productivity in Andhra Pradesh which it is trying to replicate in other states. Godrej Agrovet Farm Management System (FMS) • Developed to monitor the company’s palm oil business output. • Focuses on outputs achieved. • Collects tag variables on farmer attributes, hard and soft inputs by Godrej Agrovet, and yield changes by participating farmers. • Integrated with the SAP of Godrej Agrovet. • Field officers enter data into handheld and farmers and Godrej managers get instant SMS on the transaction. • Godrej support in providing saplings and technical services is also recorded. • Other factors are not recorded eg machine downtime, farmer credit transactions. • Targets: • At the start of the year, Godrej gives projected target to the farmers for crop yield, based upon field officer visits to the assigned area in April, in which targets are set after considering soil and weather conditions for the season. • In September, the targets are revised based upon actual production in the previous six months. 39
Variables measured by Godrej Agrovet focus on improving productivity and expanding output Tag Variables • System generated Unique Farmer Code • Farm Location—geo tagging of latitude and longitude • Farm area—total land holding, total land cropped • Irrigation type • Soil type • Weather • Inputs provided—saplings, fertilizer, pesticide by: • Quantity • Grade • Monetary value Input Variables • Farm output: • Quantity • Grade • Quality • Monetary value • Productivity Output Variables • Godrej Agrovet is ready to adopt more tag and input variables if have key impact on improving output and productivity. 40