Download
1 / 46
460 likes | 572 Vues
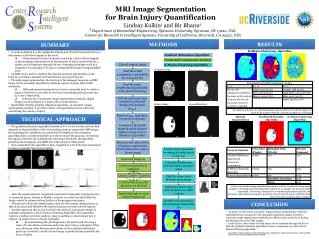
This study addresses the need for reliable automated brain segmentation methods in MRI analysis, essential for research into neurological disorders like schizophrenia, Alzheimer’s disease, and Parkinson’s. Current manual tracing methods are labor-intensive and inconsistent, making automation crucial for scalability and accuracy. By employing artificial neural networks (ANN) and multi-modal imaging techniques, this approach enhances segmentation reliability against noise and anatomical variability. Our goal is to improve accuracy and consistency in comparing automated segmentation with the traditional gold standard of manual methods.

E N D
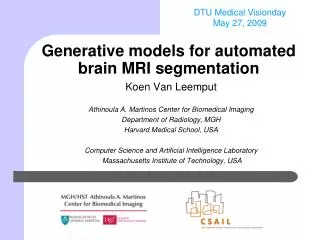
BRAINSCutHuman brain segmentation for volumetric measures EUN YOUNG (REGINA) KIM BIOMEDICAL ENGINEERING DEPT. 2011 Nov 02
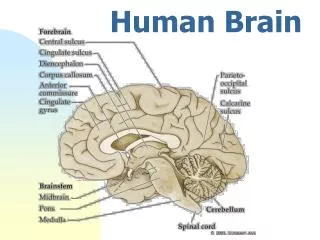
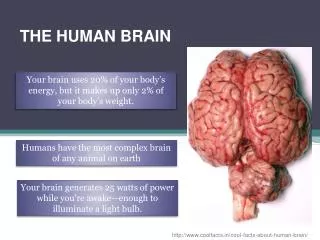
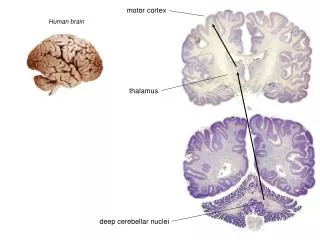
Motivation • MR Images are broadly used for Disease Research : Schizophrenia, Alzheimer, Huntington’s Disease, Parkinson’s, isolated clefts of the lip or palate, and many others • Currently, Manual tracing method of MR Image is regarded as a gold standard for the analysis. • Labor intensive task • Inconsistency • Large scale data from multi-site • Development of Reliable Auto-segmentation Method is Mandatory. Image from “http://www.slicer.org/slicerWiki/images/f/ff/EMSegment31Structures.png”
Motivation • Existing ANN application*** • Developed and trained several years ago with old data set • Existing ANN application*** improved with • newly adapted feature • Multi modality images • simultaneous training strategy * Magnotta et al. Measurement of Brain Structures with Artificial Neural Networks: Two-and Three-dimensional Application Radiology (1999) * Powell et al. Registration and machine learning-based automated segmentation of subcortical and cerebellar brain …. NeuroImage (2008)
Goal • Reliable Auto-segmentation • Robustness • against noise of an image e.g. inhomogeneous of MRI intensity • against anatomical variability ranging from severely diseased to normal healthy control. • Accuracy • Measurement accuracy should be achieved in compare to the a gold standard, ‘manual segmentation’ • Consistency • linear relationship between automated method and manual segmentation
General Overview of Machine Learning (Symbolic vs. Connectionist Perspective) More Background of Connectionist Perspective: Artificial Neural Net Background
Background: Artificial Intelligence • Symbolic vs. Connectionist • How to represent and organize data well enough!? Organized with information Red is-a Color Simple Data Table Name is-a Red Q: What is name of red fruit?? Name is-a Apple Color is-a Red Apple is-a Fruit
Background: Machine Learning • Symbolic vs. Connectionist • Simulate the functioning of the human brain biologically o ni-1 ni o Σ fa() Σ ni+1 o Biological Neuron Perceptron Artificial Neural Network
Background: ANN Architecture Two layered architecture Multi-layered architecture Hidden Layer 1 Hidden Layer 1 Hidden Layer n Hidden Layer n Input Layer Input Layer Input Layer Output Layer Output Layer Output Layer
Background : ANN y y x x `Perceptron Convergence Theorem’ by Rosenblatt et al (1963) : Guarantees that the perceptron will find a correct solution with large enough number of training for linearly separable problems Practical data does NOT provide the condition. Minsky and Papert [1969] : Multilayer network generally solves any given problem. ANN is a `General Approximator’ any given mapping function for desired accuracy independently by Kurt Hornix [1989] and Cybenko [1989] independently.`
Background : ANN Learning Hidden Layer 1 Hidden Layer n-2 Input Layer Output Layer Feed Forward Data gi Back Propagating Learning Figure: Feed forward, fully connected network with Back propagation Algorithm
General Work Flow Input Features Validation and verification method Method
Preprocessing from BRAINS Tool Pre-processing For BRAINSCut
Method : Basic Work Flow Optimization
Method: Input Feature Vector • Images • Brain Atlas • Prior • Multi-modality Images • Feature Enhanced Images • Features • Location • Neighborhood • Candidates Pure CSF Pure Grey Matter Pure White Matter etc CSF Grey Matter White Matter etc 0 10 70 130 190 250 255
Method: Input Feature Vector • Images • Brain Atlas • MNI • Prior • Multi-modalities • Feature Enhanced • Features http://www.bic.mni.mcgill.ca/brainweb/
Method: Input Feature Vector • Images • Brain Atlas • Prior (16 subjects) • Manual data • Registering • Averaging • Multi-modalities • Feature Enhanced • Features Right Caudate Left Putamen Spatial Probability Density Image Left Globus
Method: Input Feature Vector • Images • Brain Atlas • Prior • Multi-modalities • T1-weighted • T2-weighted • Feature Enhanced • Features T1-weighted Image T2-weighted Image
Method: Input Feature Vector • Images • Brain Atlas • Prior • Multi-modalities • Feature Enhanced • Tissue Classified • Mean of Grad. • Features Pure CSF Pure Grey Matter Pure White Matter etc CSF Grey Matter White Matter etc 0 10 70 130 190 250 255 Tissue Classified image* Mean of Gradient Magnitude * Harris, G., Andreasen, N.C., Cizadlo, T., Bailey, J.M., Bockholt, H.J., Magnotta, V.A., Arndt, S., 1999. Improving tissue classification in MRI: a three-dimensional multispectral discriminant analysis method with automated training class selection. Journal of Computer Assisted Tomography 23 . 1 , 144 (1) 154.
Method: Input Feature Vector • Images • Features T1-weighted Image T2-weighted Image Tissue Classified image Mean of Gradient Magnitude
Method: Input Feature Vector z z z φ • Images • Features • Location • Neighborhood • Candidates φ ρ ρ Original Definition θ θ Modified Definition Modified spherical coordinate system
Method: Input Feature Vector • Images • Features • Location • Neighborhood • Candidates Neighbors along the Gradient Descents
Method: Input Feature Vector • Images • Features • Location • Neighborhood • Candidates ( 1, 0) ( 0, 1) ( 1, 0) ( 1, 1 ) Candidates Vector based on Priors
Method: Output Vector and Training • Boolean Vector • Expanded for Simultaneous Training ( 0, 0) ( 0, 1) ( 1, 0) ( 0, 1 )
Method : Training Hidden Layer Input Layer z Output Layer ρ θ φ
Method : Over fitting error Train Error Function Performance Error Function Optimally Trained Point Train time
Validation and Verification • Mean and Variance • Relative Overlap and Similarity Index • Pearson’s Correlation • Intraclass Correlation (Fless & Shrout[1979], McGraw & Wong[1996] ) • Agreement • Consistency MSJMean square error between judges MSSMean square error between subjects MSEMean square error KNumber of Judges NNumber of Subjects
Result with newly adapted Features Result with threshold for neighboring structures Result with Simultaneously Trained ANN result
Result • Manual expert traced training sets and validation sets defined • 16 subjects used for training • 8 subjects used for validation • Trial Cases • By Different number of hidden nodes ( HN =50,60,70, and 80) • By Different distance along the gradient descents ( Grad=1 and 2 )
Result: Individually Trained ANN Error function to see convergence, HN=60, Grad=1
Result: Individually Trained ANN ICC measures consistency(red), agreement(blue) and RO for Optimal Threshold , HN=60, Grad=1
Result: Individually Trained ANN Summary of Result, HN=60, Grad=1
Method : Threshold • Threshold for neighboring structures • Mutually Exclusive each other • Fully defined for in-between space { , T > threshold 0 , Otherwise ,where Aris ANN output for region of interest
Result using Threshold for neighboring structures Before Threshold After Threshold
Result: Simultaneously Trained ANN • Take account natural biological Definition of Structure • Disjointed • No gaps between structures
Very Recent results? Data quality has improved 1.5T to 3.0T Pre-Processing improves Therefore, BRAINSCut improves… …
Acknowledgement Prof. Hans J. Johnson BRAINS Imaging Developers! PINC laboratory!