Shrimp Improvement Systems
Shrimp Improvement Systems. The Importance of shrimp. broodstock and PL quality for successful and sustainable shrimp farming. Dean M Akiyama. David A Leong. Shrimp Improvement Systems, India. What is the major constraint for commercial shrimp. farming sustainability?. - Environment?.

Shrimp Improvement Systems
E N D
Presentation Transcript
Shrimp Improvement Systems The Importance of shrimp broodstock and PL quality forsuccessful and sustainable shrimp farming Dean M Akiyama David A Leong Shrimp Improvement Systems, India
What is the major constraint for commercial shrimp farming sustainability? - Environment? - Production system? - Feed & Feed Resources? - Disease? - Market demand? - Other? 2
What is the major constraint for commercial shrimp farming sustainability? Shrimp farmer profitability is critical for continued growth of the shrimp culture industry. 3
What are the basic foundationtechnologies for commercial shrimp farming? - Hatchery: Production of consistent quality seed - Production: Consistent & predictable harvests - Feed: Production of consistent quality feed - Genetics: Production of consistent quality broodstock and the improvement of commercially important traits - Disease: Solutions for hatchery and farming - Market: Access and demand 4
Human Nature Greed of the farmer always overcomes the need for controland predictability of harvests
The chicken industry is a good model for shrimp. It is the most advanced andsophisticated of all animal production industries. 6
Broiler Production Predictability • 25 C with 85% humidity?? - Cooling panel (water fall) to lower temperature - Fan to pull air past water assisted cooling panel and through house. Also remove excess nitrogen. Replace litter after every cycle to remove feces and bacteria
Broiler Production Predictability • 75% of all chickens can feed at the same time • 40 broilers per feeder • 8 broilers per water nipple • 20 kg per m, not number of birds
Broiler Production Predictability “Guaranteed” production by Breeder Company and Local Distributor • Cycle period: 35 days • Final size: 2.2 kg • FCR: 1.5 • Survival Rate: 96% • Dressing weight: 67%
It is easier to change the chicken house, than tochange the chicken. Henry Saglio, Geneticist 10
Controlled Production Systems PL10 stocked in raceways with minimum 6 ppm DO, stabile temperature and pH, will reach 35 g in 100 days. Siblings stocked in pond vs perimeter cages ADG 0.18 vs 0.25 (39%)
We must always strive to improve technical efficiencies and the reduce the cost ofproduction. This is anever ending process. 12
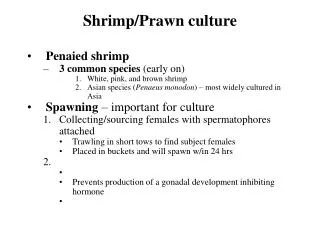
Alternative Species Vannamei : Chicken : Lowest cost Monodon : Turkey : Largest Stylirostris : Duck : Sweetest
SIS has 4 Production Facilities • SIS Florida; 1998 - Nucleus Breeding Center for Penaeus vannamei, the Pacific white shrimp. All of SIS P. vannamei stocks originate from Florida. - Broodstock multiplication with capacity to produce and ship about 120,000 commercial broodstock annually. • SIS Singapore; 2005 - Broodstock multiplication with capacity to produce and ship about 150,000 commercial broodstock annually. • SIS Hawaii; 2006 - Nucleus Breeding Center for Penaeus monodon, the black tiger prawn and Penaeus stylirostris, the blue shrimp. - Broodstock multiplication with capacity to produce and ship about 250,000 commercial broodstock annually. • SIS India; 2012 - Shrimp hatchery for P Vannamei.
Shrimp Improvement Systems Genetic Program Major genetic discoveries based on tracking of genetic line performance from strategic alliances with integrated farms, hatcheries and processing plants
Shrimp Improvement Systems Breeding Program • 15 years of commercial genetic improvement and research. • Pure lines selected for specific traits over 20 generations. • Inter- and intra-familiar selection for growth, disease resistance, reproductive capacity and general hardiness. • 12 breeding sessions per year, each one with 40 families. 480 full- pedigree families created and evaluated each year. • Genetic advantage is calculated from the results of field and lab performance tests and pedigree information. • The best families from each breeding session are used to generate families for the next generation. • Working on lines that exhibit resistance to multiple pathogens; i.e. TSV and IMNV.
Genetic Family Selection Original families in each breeding session Families divided into two groups Siblings for disease challenges & field evaluations SPF siblings maintained atNucleus Breeding Center (NBC) Data from field evaluations Disease challenge (off-site) Top performing families Discard survivors(never return to NBC) Top families fast-tracked to broodstock Genetically Improved Stocks To Customers
Phases of SIS Breeding Program I. MATURATION II. HATCHERY III. NURSERY IV. GROWOUT ~2 Months 1 Month 2 Months 4 to 7 Months 40 g + 0 to PL-20 PL-20 to 8 g 5 to 40 g + Family selection for Intra and Inter-family Performance testing Inter and intra-family mating rate and selection for for Growth, Disease selection for Growth fecundity hardiness resistance and general hardiness
Disease Challenge Facilities Virus challenge selection primarily for TSV and IMNV
Commercial Farm Microcosm Testing Facilities Water from commercial production ponds are pumped through Microcosm tank system.
Commercial Farm Cage Testing Facilities Family selections made at commercial farm site
Commercial Farm Cage Testing Facilities Selected families stocked in commercial production pond
Broodstock Quality Quality factors for broodstock quality are notclearly defined but rapidly improving. - Genetic pedigree most critical - Virus free (SPF plus) - Stabile production conditions from PL to harvest - Age and size - Minimum 38g female and 35g male - Acclimation : 4 weeks for 40hr transport stress 2 weeks for 10hr transport stress
Definition of SPF • Specific Pathogen Free Stock refers to thehealth status of a stock and not a genetic characteristic. To be SPF a shrimp must befree of all “known” shrimp virus. • Specific Pathogen Resistant Shrimp refers toa Genetic characteristic- being resistant to aspecific pathogen (not general disease). • All commercial broodstock are SPR to somedegree but all may not be SPF.
Specific Pathogen Resistance (SPR) • Resistance comes in the genes, it isNOT developed by exposure to pathogens. Resistance genes are already present in the genome of the species. • Selection for disease resistance aims to find and concentrate these genes in the animal. • Challenge tests are run on siblings or progeny in order to gather information. Never on the animals that are used commercial or breeding broodstock. • By applying these principles, SIS has broodstock which are virus free, SPF and SPR.
Routine Disease Monitoring • INDIA, for every shipment , samples are taken and sent to University of Arizona. • Routinely every 3 months, shrimp samples are collected from SIS facilities. • Samples are submitted to independent and Government recognized pathology laboratories. - Dr Don Lightner, University Arizona; Florida, Hawaii, Singapore - US Federal Animal and Plant Health Inspection Service (APHIS); Florida - Hawaii State Aquatic Veterinarian Service; Hawaii - Agri Food and Veterinary Authority Of Singapore; Singapore • Samples are analyzed for all the diseases and viruses as specified by USMSFP and OIE.
SIS “Virus Free” Status • Documented 15 year history of certified SPF status. • Authorized supplier of broodstock and PLs into India, Indonesia, Thailand, China, Vietnam, Malaysia, Philippines, South Africa, Brazil, Ecuador, Venezuela, Belize, Honduras, Panama, Surinam, Jamaica, Puerto Rico, Cuba and USA. • Authorized to supply SPF PLs and broodstock to US growers in Texas, Alabama, and South Carolina. • Annually certified by State of Florida as compliant with Best Management Practices.
SIS Critical Performance Criteria SIS Values 2006 2014 • Maturation - Nauplii/female/month 350,000 700-800,000 • Hatchery - Survival rate 45% 55-75% • Pond Production - Growth rate 0.14 g/d 0.18-0.25 g/d – Survival rate 70-80% 75-85% – CV size 18% > 12%
Biosecurity is Critical • Biosecurity is all of the procedures used to protect living organisms from contracting,carrying, and spreading diseases. • These include Isolation of site, Traffic controlof vehicle and people, Sanitation and Disease surveillance procedures. • A proven history is the only evidence of commitment and dedication to biosecurity.
Biosecurity Protocols at Nucleus Breeding Center • All shrimp reared indoors, protected from birds, crabs and feral animals. • Restrict visitors and then everyone entering facility must change to SIS clothing and foot ware. • Vehicle tire bath, footbaths and hand washing stations at entry into each separate culture area. • Entire facility encircled by chain link fence and crab barriers. • Water source is a fossil seawater well. Water is aseptic, except for some anaerobic sulfur bacteria. • All effluents are chlorinated and diverted to dispersion wells. No effluent is released into the environment.
Biosecurity NBC - indoors Water filtration
INDIA produced broodstocks: F2 • Are local produced broodstocks from a biosecure facility from maturation to broodstock harvest? • Without a reliable genetic selection program, what is the animal performance loss in pond production per generation? 10%? • The cost savings of broodstock for the hatchery is insignificant relative to the risk of farm failure. • The fastest way to spread and transmit a disease is through infected broodstock and PLs. Essential to secure reliable and consistent source of virus free broodstock and PLs.
Quality Post Larvae Quality factors for shrimp post larvae are routine and common industry knowledge. - Necrosis - Size variation - Deformities - Activity level - Luminescent bacteria - Gut-muscle ratio - Ectoparasites - Chromatophores - Muscle Clarity - Stress tests However, there are other factors which also affect PL quality.
Post Larvae Required Age for Gill Development PL6 gill development not complete. Depends on growth rate but between PL8-10. Gill development required for DO andosmoregulation : minimize stress. Survival PL6 78% PL10 85%
Effect of PL age for salinity stress test: 30 ppt to 5 ppt for 2 hours PL Age Harvested SurvivalRate Tanks 6 5 52 8 3 77 10 7 94
Gill Development Sequence Pl-6 Pl-8 Adult Pl-10
PL quality parameters to Pond Performance • 2011 - 2013 pond performance data from 18,000 harvested ponds (2,500-5,000 m per pond) • Only ponds which were from one broodstock family and harvested from one hatchery tank were being analyzed (9,500 ponds) • Hatchery tanks harvested, 8,500 tanks producing 5-8 million PL10 per tank (55 billion PLs) • PL length and SD/CV adjusted to PL10 parameters • Growth rate in hatchery (PL ADG) was the PL length divided by total time • Harvested biomass adjusted to 100 days in 1 ha pond area
Segmentation of Hatchery Parameters • Low category fall approximately about 25% of the lowest data • Medium take approximately 50% of the mid range data High • High categories were the top 25% of the data Hatchery Parameter Low (25%) Medium (50%) High (25%) Hatchery SR (%) SR < 57.7 57.7 ≤ SR < 81 81 ≤ SR < 100 PL Length (mm) Lgth < 8.95 8.95 ≤ Lgth < 9.52 9.52 ≤ Lgth < 11.35 ADG (mm/day) ADG < 0.5688 0.5688 ≤ DG < 0.6175 0.6175 ≤ DG < 0.7129 CV (%) CV < 4.5 4.5 ≤ CV < 6.68 6.68 ≤ CV < 12.45
Pond performance based on survival rate in hatchery (2010-13) Hatchery Parameter <58% 58-81% 82-100% Number of ponds 2,018 4,042 2,012 Biomass (MT/ha) 12.40b 12.53b 12.60a MBW (g) 18.37b 18.51a 18.59a ADG 0.184b 0.185a 0.186a Survival (%) 79.4a 79.4a 79.0a High hatchery SR produces better biomass, MBW and ADG in ponds but not affect survival rate.
Pond performance based on PL10 length in hatchery (2010-13) Hatchery Parameter <8.95 8.95-9.52 9.53-11.35 Number of ponds 2,012 4,431 2,083 Biomass (MT/ha) 12.44b 12.47b 12.74a MBW (g) 18.33b 18.39b 18.86a ADG 0.183b 0.184b 0.189a Survival (%) 79.1a 79.4a 79.4a PL10 Length does have positive correlation with pond performance but no affect on survival.
Pond performance based on growth (ADG) in hatchery (2010-13) Hatchery Parameter <0.57 0.57-0.62 0.63-0.71 Number of ponds 2,063 4,310 2,153 Biomass (MT/ha) 12.24c 12.49b 12.85a MBW (g) 18.28c 18.43b 18.82a ADG 0.183c 0.184b 0.188a Survival (%) 78.8b 79.4a 79.5a Better animal growth rate in hatchery had positive correlation with pond performance. This correlation was better than PL length alone.
Pond performance based on CV in hatchery (2010-13) Hatchery Parameter <4.5 4.5-6.7 6.8-12.5 Number of ponds 2,146 4,185 2,140 Biomass (MT/ha) 12.69a 12.66a 12.08b MBW (g) 18.60a 18.54a 18.31b ADG 0.186a 0.185a 0.183b Survival (%) 79.5a 79.2a 79.2a Better animal CV size in the hatchery had positive correlation to pond performance but no affect on survival.
Luminescent bacteria affect on hatchery performance (2010-11) Hatchery Parameter Lumbac No Lumbac Number of tanks 614 605 Flushed tanks (%) 14.4% 6.0% Survival (%) 63.19a 62.25a PL10 length (mm) 9.14b 9.25a ADG PL10 0.54b 0.55a CV size PL10 5.38a 5.50a Compared hatchery tanks were stocked with same family.
Luminescent bacteria affect on pond performance (2010-11) Hatchery Parameter Lumbac No Lumbac Number of ponds 2,305 5,933 Harvested biomass (MT/ha) 10.97b 11.44a MBW (g) 17.7b 18.2a ADG 0.177b 0.182a FCR 1.87b 1.82a Survival (%) 72.3b 74.6a
Conclusion PL Quality Trials • Hatchery tank survival rate, PL10 length, PL10 ADG, CV size and luminescent bacteria all affected pond performance but not pond survival rate. • Pond survival rate is not a reliable pond performance parameter because difficult to know exactly how PLs have been stocked. • PLs has been estimated to have 10-20% influence on pond production. Success is highly dependant on farm management. • All other parameters such as stress tests, necrosis, gut muscle ratio, etc…. had no correlation to pond performance. • All tested PLs were virus free.
Quality Post Larvae The production of consistent quality post larvaerequires a “Commitment to Quality” and discipline to implement a quality assurance program. - Virus free: nauplii, PL3, PL8 - Minimum tank survival rate: 30% - CV size less than 7 - Minimum ADG: 9 mm PL10 - Luminescent bacteria free Must reject or flush tank if less than standard.
SIS STRENGTHS & VALUES • Fast growth • Uniform harvest size • Resistance to diseases: TSV and increasingly IMNV • High fecundity • Virus free broodstocks for 15 years