Download
1 / 11
110 likes | 129 Vues
This symposium explores the effect of fuel prices and driving costs on demand for driving and fuel. Analyzing drivers' responses and elasticities, the findings highlight shifts influenced by factors like income growth and fuel price fluctuations. The relevance of policies to reduce fuel consumption is discussed, emphasizing the effectiveness of tools such as fuel taxes and fuel economy standards. Considerations of energy security, CO2 emissions, market failures, and other policy issues in transportation are explored to provide insights for policymakers aiming to address fuel consumption challenges.

E N D
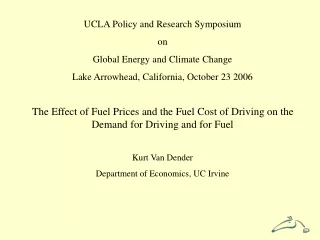
UCLA Policy and Research Symposium on Global Energy and Climate Change Lake Arrowhead, California, October 23 2006 The Effect of Fuel Prices and the Fuel Cost of Driving on the Demand for Driving and for Fuel Kurt Van Dender Department of Economics, UC Irvine
UCLA Policy and Research Symposium • on • Global Energy and Climate Change • Lake Arrowhead, California, October 23 2006 • The Effect of Fuel Prices and the Fuel Cost of Driving on the Demand for Driving and for Fuel • Changes in drivers’ responses • Relevance to policies to reduce fuel consumption • Relevance of policies to reduce fuel consumption?
Changes in drivers’ responses: framework • How do drivers respond to changes in the fuel cost of driving? • Aggregate measures: the amount of driving (M), fuel economy (E), size of vehicle stock (V) • Size of the response: elasticities • E.g. own price elasticity of demand for fuel -0.40 means that a 10% increase in the fuel price leads to a 4% reduction in the quantity of fuel demanded • Elasticities are estimated using econometric models. • Changes in drivers’ responses show up as changes in the estimated elasticities. • Recent evidence: K. Small and K. Van Dender, 2007, Fuel efficiency and motor vehicle travel: the declining rebound effect, Energy Journal, 28, 25-51
Changes in drivers’ responses: findings - 1 • The elasticity of the demand for driving with respect to the fuel cost of driving has declined. • Why? Income growth, declining real fuel prices. • (no evidence for effect of urbanization) • Key long run elasticities: Standard errors not shown. Relevant coefficients are significant at 95%-level.
Changes in drivers’ responses: findings - 2 • The elasticity of the demand for driving with respect to the fuel cost of driving (PM = PF/E) has declined as incomes increased and real fuel prices declined. • Consequently, the demand for fuel has become less responsive to fuel prices. Standard errors not shown. Relevant coefficients are significant at 95%-level.
Changes in drivers’ responses: findings - 3 • The elasticity of the demand for driving with respect to the fuel cost of driving (PM = PF/E) has declined as fuel prices declined. • Consequently, higher fuel prices increase the elasticity. • (58% increase corresponds roughly to $2.35 of early 2006) Standard errors not shown. Relevant coefficients are significant at 95%-level.
2. Relevance to policies to reduce fuel consumption - 1 Effectiveness of policy tools to reduce fuel consumption. With low elasticities, reducing fuel consumption through fuel taxes requires large tax increases. Fuel economy standards (like CAFE) become more attractive, as the low elasticity translates into a small “rebound effect”: the reduction in the cost of driving has a limited effect on the demand for driving.
2. Relevance to policies to reduce fuel consumption - 2 For example, if A fuel economy increase that reduces the fuel cost of driving by 10% increases driving by 2.5%, so fuel consumption falls by 7.5% (not 10%, as would have been the case had demand for driving been fixed). This is a fairly strong increase in demand, and of the benefits from driving, but it limits the policy’s effectiveness in curbing fuel consumption (rebound effect). …our results suggest the appropriate number is
3. Relevance of policies to reduce fuel consumption? (1) Why reduce fuel consumption? Energy security, CO2 emissions (climate change) justify policy to remedy market failure. However, Current fuel taxes cover those costs Marginal external cost of energy security: around 12c/gallon* Marginal external cost of climate change: around 4c/gallon* Federal excise tax on gasoline (2004): 18.4c/gallon** Need for policy change not obvious (function of the fuel tax?). * Parry I, Should Fuel Economy Standards Be Raised?, Resources, Fall 2005, 15-19 ** Davis S. and S. Diegel, 2006, Transportation Energy Data Book – 25th ed., USDOE
3. Relevance of policies to reduce fuel consumption? (2) Why reduce fuel consumption? Market failures. However, Take account of other policy issues in transportation: MEC* Infrastructure 3-7 c/mile Congestion 4-15 c/mile Climate change 0.3-1.1 c/mile Noise 0.1-6.0 c/mile Energy security 1.5-2.6 c/mile Hence, small increases in the amount of driving may come at a high cost to society in terms of congestion and pollution (regulated on a per mile basis). So even if the rebound effect is small… * Harrington W. and V. McConnell, 2003, Motor Vehicles and the Environment, RFF Report.
3. Relevance of policies to reduce fuel consumption? (3) Why reduce fuel consumption? Market failures. But, If CO2 emissions need to decline, does it follow that fuel consumption in transportation should decline? Cheaper options may exist. The observation that transportation emits 20-30% of all CO2 in the US, does not in itself justify action in transportation.