The Scientific Method
490 likes | 673 Vues
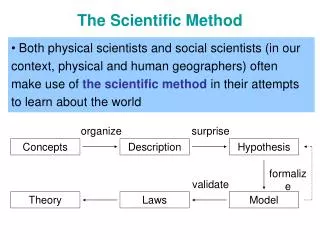
The Scientific Method. Physical Science (2011-2012). I. Introduction. A. Traditional basis for research. Most intellectual disciplines seek evidence after drawing their conclusions. Scientists Collect evidence before drawing their conclusions.

The Scientific Method
E N D
Presentation Transcript
The Scientific Method Physical Science (2011-2012)
I. Introduction A. Traditional basis for research Most intellectual disciplines seek evidence after drawing their conclusions Scientists Collect evidence before drawing their conclusions
I. Introduction A. Traditional basis for research Consequently, scientists accept and encourage challenges to existing theories The vehicle for scientific inquiry is called the Scientific Method
II. Introduction A. Purpose Provides organized process for the investigation into and to gain an understanding of natural phenomena Insures accuracy and impartiality of these investigations
II. Introduction B. Steps Observation
II. Introduction B. Steps Observation
II. Introduction B. Steps Observation a. Take note of phenomenon b. Record every factor present at and around phenomenon , detailed, Accurate quantitative
Measurement Scientists use units of measurement established , by international treaty, under the International System of Units. You might know these units as “Metric” units. Metric units are formed using prefixes and SI base units. Metric prefixes are based on fractions and multiples of “10.”
Metric Prefixes Base Units Kilo- Heka- Deka- Deci- Centi- Milli- m, g, L dk K H d c m 1,000 100 10 1 0.1 0.01 0.001
Metric Base Units Amt. of Subst. Elec. Curr. Light Inten. Length Mass Time Temp. m kg s cd mol K A Kilo- gram Sec- ond am- pere Meter mole candel Kelvin
Converting SI Units 1. Convert 1.255 liters (L) to milliliters (mL). The conversion factor is 1 L = 1,000 mL 1.255 L = __?__ mL X 1.255 L x 1,000 mL= __?__ mL 1.0 L X 1.255 x 1,000 mL= 1.255 x 1,000 = 1.0 1.0 1.255 x 1,000 mL= 1,255 mL 1.0
Converting SI Units 2. Convert 3,075 mm to centimeters (cm). The conversion factor is 10 mm = 1.0 cm 3,075 mm = __?__ cm X 3,075 mm x 1.0 cm = __?__ mL 10 mm X 3,075 x 1.0 cm = 3,075 x 1.0 cm = 10 1.0 3,075 x 1.0 cm = 307.5 cm 10
Converting SI Units 3. The Bering Land Bridge National Preserve is a summer home to bird life. Some birds migrate 20,000 miles. The conversion factor for miles is 1 mile = 1.6 kilometers. Calculate the distance the birds fly in kilometers. 20,000 mi. = ___ km X 20,000 mi. x1.6 km = 1.0 mi 20,000 x 1.6 km = X 32,000 km =
II. Introduction B. Steps Observation 2. Evaluation
II. Introduction B. Steps 2. Evaluation
II. Introduction B. Steps 2. Evaluation Scientists consider this the most difficult and important step
II. Introduction B. Steps 2. Evaluation b. Purpose is to determine: Which factor was the phenomenon
The factor that was the phenomenon is called the Dependent Variable
II. Introduction B. Steps 2. Evaluation b. Purpose is to determine: Which factor was the phenomenon 2) Which factor caused the phenomenon
The factor that caused the phenomenon is called the Independent Variable
II. Introduction B. Steps 2. Evaluation b. Purpose is to determine: 2) Which factor caused the phenomenon 3) Which factors were present, but not part of the phenomenon
The factors that were present but not part of the phenomenon are called the Controlled Variables
Variable Managed? If so, how? Controlled Yes Kept absolutely constant/unchanged Independent Yes Changed exactly as described in hypothesis Hands off!! Must bemeasured metrically Dependent No
II. Introduction B. Steps Observation 2. Evaluation 3. Hypothesis
II. Introduction B. Steps 3. Hypothesis a. Is a PREDICTION b. Three parts Controlled var. 1) If. . . Independent var. 2) and. . . 3) then. . . Dependent var.
(List all the controlled variables) If (state exactly and in detail how the independent variable will be manipulated) are kept constant, and , then (specifically and quantitatively predict what will happen to the dependent variable).
II. Introduction B. Steps Observation 2. Evaluation 3. Hypothesis 4. Experimentation
II. Introduction B. Steps 4. Experimentation
II. Introduction B. Steps 4. Experimentation a. Tests hypothesis b. Objective and accurate c. Scientifically valid
c. Scientifically valid 1) Test hypothesis a) Validate hypothesis Does prediction happen? 2) “Tight” design a) Controlled var. b) Independent var. c) Dependent var.
II. Introduction B. Steps Observation 2. Evaluation 3. Hypothesis 4. Experimentation 5. Analysis
II. Introduction B. Steps 5. Analysis a. Examine the data Does the data support the hypothesis?
5. Analysis c. Requires data analysis 1) Mathematical Mean Median Mode Range
5. Analysis c. Requires data analysis 1) Mathematical 2) Graphic Data Tables
Sunlight (Days) 1 2 3 4 5 P l a n t G r o w t h 1 2 3 4 5 6
5. Analysis c. Requires data analysis 1) Mathematical 2) Graphic Data Tables Line Graphs
P l a n t G r o w t h Sunlight v. Plant Growth 5 4 3 2 1 0 (mm) 1 2 3 4 5 Sunlight (Days)
5. Analysis c. Requires data analysis 1) Mathematical 2) Graphic Data Tables Line Graphs Bar Graphs
P l a n t G r o w t h Sunlight v. Plant Growth 5 4 3 2 1 0 (mm) 1 2 3 4 5 Sunlight (Days)
5. Analysis c. Requires data analysis 1) Mathematical 2) Graphic Data Tables Line Graphs Bar Graphs Pie Charts
II. Introduction B. Steps Observation 2. Evaluation 3. Hypothesis 4. Experimentation 5. Analysis 6. Conclusion
II. Introduction B. Steps 6. Conclusion If he data supports the hypothesis, SAY SO. “The data supported the hypothesis.”
II. Introduction B. Steps 6. Conclusion b. If he data did not support the hypothesis: 1) State, “The data did not support the hypothesis.” Return to Step 2— Evaluation; repeat process.
Science demands continuous, honest, rigorous examination of natural phenomena. No explanation is above review and revision—even rejection. If a hypothesis/theory/law is found insufficient or valid, it is simply revised or rejected. NEVER LIE ABOUT YOUR DATA!!
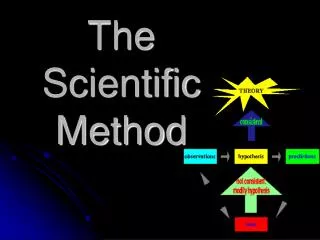
Steps of Scientific Method Observation 2. Evaluation 3. Hypothesis 4. Experimentation 5. Analysis 6. Conclusion No Data supports hypothesis Publication Yes
Scientific Method Flipbook Create a six-page, illustrated flipbook that describes the scientific method. Also, include a cover page. Each page should include: a. The name of the step b. A description of the step c. An illustration of the step. The flipbook is due at the beginning of our next class. It is worth 60 points.
Scientific Method Flipbook The Scientific Method Observation Evaluation Hypothesis Experimentation Analysis Conclusion