The Scientific Method
The Scientific Method. Unit 1: The Scientific Method Chapter 1-1 & 1-2. Scientific Method. The scientific method is a problem-solving procedure used by scientists to seek answers to questions. Scientific Method. 1. Identify a Problem 2. Create a Hypothesis

The Scientific Method
E N D
Presentation Transcript
The Scientific Method Unit 1: The Scientific Method Chapter 1-1 & 1-2
Scientific Method • The scientific method is a problem-solving procedure used by scientists to seek answers to questions.
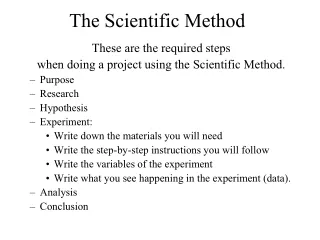
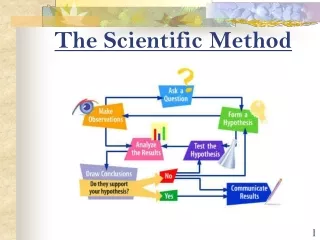
Scientific Method 1. Identify a Problem 2. Create a Hypothesis 3. Design and perform an experiment. 4. Record Data and Analyze 5. State a Conclusion 6. Check for sources of error
1. Identify a Problem • Observations are descriptions about the way something is or the way things happen • From these observations, a question is formed about why or how
Checking for understanding • Barney observes: • When I drink Coke, I burp a lot. • What is a question that Barney can ask Professor Frink?
2. Create a Hypothesis • A Hypothesis is a prediction that can be tested • Should be written in the form of an “If…, then…” statement
Checking for understanding • If people ______________, then they will ______ more. Can this hypothesis tested?
Hypothesis vs. Theory • Hypothesis: a prediction that can be tested and may or may not be true • Theory: a well-tested explanation that is supported by many types of evidence. • In science, theories are nearly facts • Ex. Theory of Evolution, Theory of Relativity, Cell Theory
3. Controlled Experiment • Hypothesis is tested • Procedure—the steps followed during an experiment • Controlled experiments have experimental group(s) & a control group
Example: • Professor Frink wants to determine if Coke will increase the frequency of burping. • He gives 10 volunteers (subjects) from Springfield Coke and another 10 subjects water. All other conditions are kept the same. • All people are 20-30 years old • All people are healthy. • All people have to not eat or drink for 3 hours before the experiment.
Variable: anything that can influence the outcome of the experiment • Control Group: group where all variables are kept the same • Used as “normal” for comparison • Experimental Group: group(s) where all the variables are the same except the one variable being tested
Checking for understanding • Professor Frink gives 10 volunteers (subjects) from Springfield Coke and another 10 subjects water. • All people are 20-30 years old • All people are healthy. • All people have to not eat or drink for 3 hours before the experiment • Which group is the control group? • Which group is the experimental group? • What are the variables that are being controlled?
Independent Variable: What is being tested • The variable that is changed • Dependent Variable: What is measured or observed • The variable that changes because of the independent variable
Checking for understanding • If people drink Coke, then they will burp more. • Professor Frink gives 10 volunteers (subjects) from Springfield Coke and another 10 subjects water. • What is the independent variable? • What is the dependent variable?
If people drink Coke (independent variable), then they will burp more (dependent variable).
4. Record Data & Analyze • Collect & record Data (information) • Data can be recorded in a table • Analyze the data by graphing it • Bar graphs: show comparisons • Line graphs: show changes over time
Example: Dependent Variable: what you measure Independent Variable Control
Average Number of Burps for Water vs. Coke Proper units Title • Example: Y-axis = Dependent Variable Type of Beverage X-axis = Independent Variable Label
5. Conclusions • If the results are in agreement with the hypothesis then the hypothesis is “accepted”. • If the results disagree with the hypothesis then the hypothesis is “rejected”
Checking for understanding • In the example is the hypothesis accepted or rejected? • ACCEPTED! • Why? • There were more burps with Coke than with water based on the data and the results of the graph.
6. Check for sources of error • Sources of error: things that may effect the results of the experiment • *Error can make the results of an experiment not valid!!! • Always look at the set-up of an experiment to check for error.
Possible sources of error: • Small sample size: fewer subjects may give inaccurate results • Unequal group size: you can’t compare the results of 2 groups if one group has 10 subjects and the other group has 50 subjects
Possible sources of error: (cont) • Not controlling (keeping the same) all variables except the one being tested • Length of the experiment (hours vs. days) • Amount of the variable (2 cokes vs. 1) • Type of material (coke vs. pepsi) • Other: light, temperature, age, health, gender, etc
Repeat the work: • When a hypothesis is supported by data from additional investigations, it is considered valid. • When a hypothesis is not supported, it means that we need to go back and ask new questions.
Checking for understanding • Two students decide to test the effects of Miracle-Gro fertilizer on plant growth. • They buy a rose plant and a daisy plant. • The roses are given Miracle-Gro and 1 cup of water/day and the daisies are given ½ cup of water/day. • The roses are kept in the sun and the daisies are kept in the shade. • The growth of the roses is measured daily and the daisies are measured each week. • What are some sources of error in this experiment?