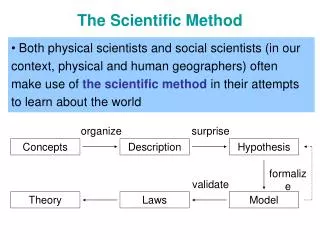
The Scientific Method
Explore the key steps of the scientific method including observation, hypothesis, experiment, and variable identification. See examples and practice activities to enhance your understanding.

The Scientific Method
E N D
Presentation Transcript
Introduction Word Search Answers Observation Qualitative Quantitative Reject Support Theory Variables Conclusion Control Data Dependent Experiment Hypothesis Independent Inference
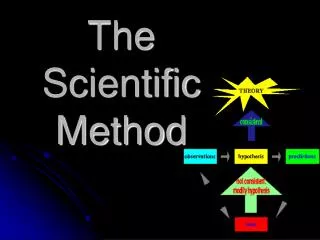
WHAT IS THE SCIENTIFIC METHOD?The scientific method is an organized procedure used to help scientists answer questions.(bottom of tab)Scientific Method…South Park Style
1. Observation The act of noting objects or events using all 5 senses Leads to collecting data The information directly collected from an experiment. Inference an interpretation or explanation of an observation Ex. observation – my car is wet inference – it must have rained
Make an observation and inference about the lifestyle of this insect. Now, let’s practice in your packet.
Observation Test – How Good Are Your Skills?
Types of Observations: • Two types of observation/data 1. Qualitative – something is described ex. purple, tall, smooth 2. Quantitative – something is measured or counted (numbers)… think QUANTITY! ex. 5mm, 20g, 10mL
Make 3 Quantitative and 3 Qualitative Observations of This Picture.
2. Asking a Question Scientists use their observations to come up with questions they would like to answer. Observation: Sand flies bite me when I have sunscreen on my skin. Question: Does the amount/type of sunscreen affect how many bites I get? (does it make me more tasty?) (foldable!)
3. Hypothesis An explanation that can be tested An educated guess based on what is already known Predictions can be made based on a hypothesis. They are the expected outcome of a test assuming the hypothesis is correct. They take the form of an “if…then” statement. We actually write our hypothesis in the form of a prediction! Ex. If the type of sunscreen has a greater amount of chemical X, then the number of sand fly bites will also increase. (foldable!) Let’s practice
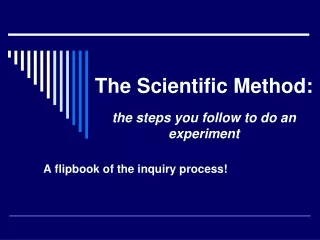
4. Experiment A planned procedure to test a hypothesis under controlled conditions Only 1 variable is changed at a time in order to obtain accurate results. A control group (receives no experimental treatment) is compared to an experimental group (receives experimental treatment). Ex. Control group – people w/o sunscreen on Experimental groups – people with different types of sunscreen on (group 1 – Banana Boat, group 2 – Hawaiian Tropic, group 3 – Neutrogena, etc.) (foldable!)
Experimental Variables • Controlled Variable – a variable that is not changed. Controls ensure that all variables in the experiment are the same except for the variable being tested. ex.) all use same amount of sunscreen (foldable) • Independent Variable – something that is changed by the scientist. This is what is tested (the treatment) or what is manipulated. ex.) different types of sunscreen (foldable) • Dependent Variable – this is what is observed, measured, or collected during the experiment. This may be affected by the independent variable. ex.) number of sand fly bites (foldable)
For FOLDABLE - Use this to remember the relationship between independent and dependent variables… How (I.V) affects (D.V). (can use this to also ask the question) To write your hypothesis: If IV increases/decreases then DV will increase/decrease.
Example 1: Students of different ages were given the same jigsaw puzzle to put together. They were timed to see how long it took to finish the puzzle.
Identify the variables in this investigation. Independent Variable = Dependent Variable = Controlled Variables = Hypothesis = “If …..then….”
What was the independent variable? Ages of the students • Different ages were tested by the scientist – this was “controlled” or “manipulated” by the scientist. What was the dependent variable? The time it took to put the puzzle together • The time was observed and measured by the scientist.
What was a controlled variable? • Same puzzle • All of the participants were tested with the same puzzle. • It would not have been a fair test if some had an easy 30 piece puzzle and some had a harder 500 piece puzzle.
Write a good hypothesis for this experiment: • Follow this format: If the independent variable increases/decreases, then the dependent variable increases/decreases. • Ex: If the age of the student increases, then the time it takes to complete the puzzle will also increase.
Example 2: An investigation was done with an electromagnetic system made from a battery and wire wrapped around a nail. Different sizes of nails were used. The number of paper clips the electromagnet could pick up was measured.
Identify the variables in this investigation. Independent Variable = Dependent Variable = Controlled Variables = Hypothesis =
Independent variable: • Sizes of nails -- These were changed by the scientist Dependent variable: • Number of paperclips picked up -- These were observed and counted by the scientist
Controlled variables: • Battery, wire, type of nail • None of these items were changed Hypothesis: • If the size of the nail increases, the number of paper clips picked up will also increase.
Example 3: The higher the temperature of water, the faster an egg will boil.
Independent variable = temperature of water Dependent variable = time to cook an egg Controlled variable = type of egg If the temperature of water increases, then the time it takes to cook the egg will decrease.
Last one: The temperature of water was measured at different depths of a pond.
Independent variable – depth of the water Dependent variable – temperature Controlled variable – thermometer Hypothesis – If the depth of the water increases, then the temperature of the water decreases.
Hypothesis = “If…then…” Independent Variable = Dependent Variable = Control Variables = Investigation #1: The greater the amount of soap in a soap and water mixture, the bigger a soap bubble can be blown.
Hypothesis = “If…then…” Independent Variable = Dependent Variable = Control Variables = Set up graph by showing me what goes on the x-axis and the y-axis. Investigation #2: The farther a ball drops, the higher it will bounce.
Experiment Review Questions • Explain the purpose of a control group. • The independent variable is the variable that you ______ and the dependent variable is the variable that you _________. • Controlled variables are variables that must remain the _____ throughout the experiment. • I want to see the effect of a new fertilizer on plant growth. What are the dependent and independent variables? What should I do for a control group? • I have 3 sodas and I want to see which will give me more energy. What are the dependent and independent variables? What should I do for a control group?
5. Collecting and Analyzing Data Data is collected and recorded in tables and graphs We then can make interpretations of the data Let’s do an example of these in your foldable!
6. Conclusion State and communicate what you found out and how you know it to be true. How did it relate to your hypothesis? Did it support or reject the hypothesis? Many times the data from an experiment will not support (or will reject) our hypothesis and we need to start the process over again. The hypothesis can either be rejected or supported by the data… IT IS NEVER PROVEN!!!!! Foldable – example conclusion for fly experiment!
Theory It is a broad and comprehensive statement of what is thought to be true. A hypothesis that has withstood the test of time. A theory may be formed after many related hypotheses have been tested and supported with experimental evidence It is supported by considerable evidence and ties together related hypotheses What are some theories you know about?
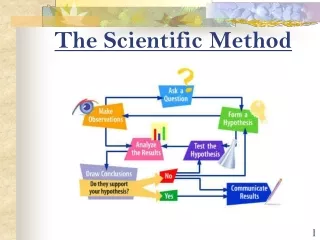
The Scientific Process Observe A Phenomenon Conclusion Pose A Question Collect Data Develop A Hypothesis Experiment
RULES FOR GRAPHING “CLEAN” Graph Covers page Lines drawn with ruler Equal distance on axis Axis labeled Name graph 1. Identify variables • Determine scales • Number/Label axis • Plot data • Draw graph • Title graph (The effect of IV on DV)
Graphing Data Examples of graphs Graphing examples quiz How to make a line graph Graphing Practice 1 Graphing Practice 2
Unit 1 Quick Review • Explain control group. • What is the first step of the scientific method? • How is a theory different from a hypothesis? • Which variable do you measure? • Which variable do you test? • Which tool do you use to measure volume? • What is the unit for volume? • I want to see the effect of a new fertilizer on plant growth. What are the dependent and independent variables? What should I do for a control group?
Why do we need the metric system? It is a common system of measurement for all scientists around the world to use. • Common system of measurement • Universal Language • SI System
What are some common conversions? 1km = 1000m 1m = 1000mm 1m = 100cm 1cm = 10mm YOU CAN CHANGE METERS TO GRAMS OR LITERS AND THE SAME CONVERSIONS APPLY. EX. 1KL = 1000L
Let’s Focus on the Microscope • Microscopes have an ocular lens (eyepiece) which magnifies 10x. They also have 3 objective lens • The objective lens have 3 powers – low (4x), medium (10x), and high (40x). • In order to determine the TOTAL MAGNIFICATION you are using you must multiply the ocular lens by the objective lens.
IMPORTANT RULES FOR FOCUSING MICROSCOPES! 1. Make sure you are in low power (4x lens). 2. Use the coarse adjustment to bring the stage up and focus in on the slide. 3. Use the fine adjustment to make the image clearer. 4. You may now switch to a higher power BUT YOU MUST NEVER TOUCH THE COARSE ADJUSTMENT ONCE YOU ARE OUT OF LOW POWER!