Download
1 / 47
490 likes | 547 Vues
Explore the principles and applications of Magnetic Resonance Imaging (MRI) and Infrared Imaging in the field of medical biophysics. Understand the concept of spin in sub-atomic particles and its significance in imaging technologies. Learn about the magnetic properties of various nuclides used in medical imaging for anatomical and physiological assessments. Discover the intricate process of nuclear magnetic resonance and its role in producing detailed images of body tissues. Gain insight into relaxation times and how magnetic field gradients help in creating accurate patient images.

E N D
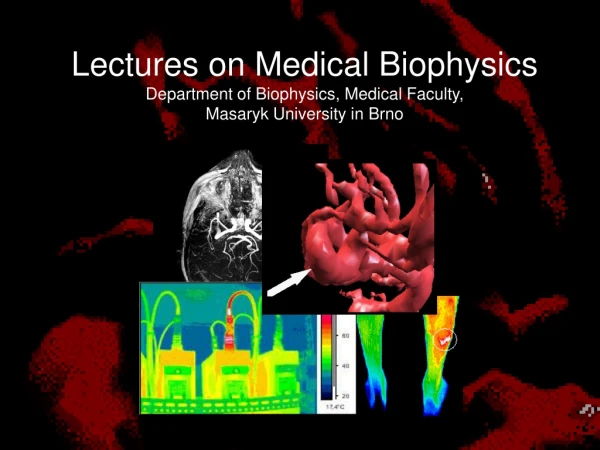
Lectures on Medical BiophysicsDepartment of Biophysics, Medical Faculty, Masaryk University in Brno
Lectures on Medical BiophysicsDepartment of Biophysics, Medical Faculty, Masaryk University in Brno Magnetic resonance imaging (MRI) Infrared imaging (thermography)
The common feature of these imaging methods is the use of non-ionising radiation and the absence of genetic damage. Magnetic resonance imaging (MRI) is one of the most advanced imaging methods which gives both morphological and physiological (functional) information. The first MR image (cross-section of chest) was obtained by R. Damadian in 1977. Infrared imaging is a functional imaging method giving pictorial information on body surface temperature and thus level of metabolism. It is absolutely safe for the patient as the images are produced by IR radiation given out by the patient himself. First infrared cameras appeared in late 60‘ of 20th century. Magnetic resonance imagingInfrared imaging
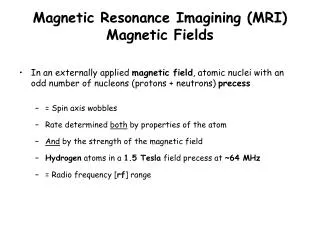
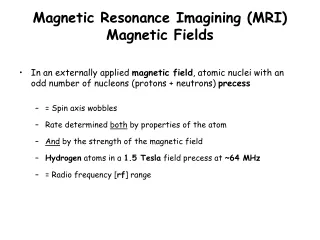
Spin is a specific property of sub-atomic particles (electrons, protons etc) like electric charge and mass Spin has some strange properties! electrons, protons and neutrons all have the same spin i.e., 1/2 pairs of particles of a single type (e.g., 2 electrons or 2 protons or 2 neutrons) can have a total spin of zero! particles having non-zero total spin act like small magnets (we say they have a ‘magnetic moment’) and their energy is affected if placed in a magnetic field Spin
In MRI we are interested in the spin of NUCLEI In medicine, we use the magnetic properties of mainly light nuclides like hydrogen1H, phosphorus 31P, carbon 13C, fluorine 19F or sodium 23Na to get anatomical or physiological information. Total Nuclear Spin (I)
The magnetic moment m of a nucleus is proportional to its angular momentum S (m = g.S, g isthe gyromagnetic ratio) which depends on the total nuclear spin I. In the absence of an external magnetic field, the magnetic moments of nuclei have all possible (random) directions with the result that: The vector sum of the nuclear magnetic moments in a unit volume of a substance, i.e. the magnetisation vector, is equal to zero The energy of all nuclei is the same MRITheory
When hydrogen nuclei are placed in an homogeneous strong magnetic field with magnetic flux density B: Their individual magnetic moments will precess with an axis parallel to the direction of B and orientate themselves either in the same direction or in the opposite direction to B. Therefore they have only two possible energies (a higher and a lower energy state). The angular frequency of rotation of this precession (i.e., number of revolutions per second) - is calledthe Larmor angular frequencyw and is given by : = g B g=gyromagnetic ratio The hydrogen nuclei in the body precess at about 42.6 MHz if B = 1T H Nuclei in a Uniform Magnetic Field B
Magnetisation Vector P - hydrogen nucleus (proton), B - magnetic flux density, z - axis identical with axis of precession (parallel with B), m - magnetic moment of nucleus, mL - component of the magnetic moment of nucleus in z axis (vector sum of these projections in unit volume of a substance is the longitudinal magnetisation vector), mT – projection of m in xy plane (vector sum of these projections in unit volume is the transverse magnetisation vector).
For H nuclei in the lower energy state to move to the higher energy state RF pulses of frequency equal to the Larmor frequency must be transmitted towards the patient using a transmitter coil (hence the ‘resonance’ in MRI). When this occurs the nuclei are also forced to precess in phase. Longitudinal magnetisation vector becomes oriented in opposite direction Transverse magnetisation vector appears and rotates in plane xy. The return to the ground state (relaxation) is accompanied by the emission of a quantum of electromagnetic energy, which is when detected by an antenna (receiver coil) - thenuclear magnetic resonance (NMR) signal. The signal is relatively strong since the nuclei are precessing in phase. The amplitude of the pulse is proportional to the H density in the tissues (often known as ‘spin density’) . Measuring H(ydrogen) Density in Tissues
We have tworelaxation times: T1 – longitudinal (spin – lattice)- time necessary for return of the “population” of nuclei to the ground state. In biological media: 150 - 2000 ms. Longitudinal magnetisation vector returns to original direction during this time. T2 – transversal (spin – spin)- 2x - 10x shorter than T1. After this time interval the precession movement of individual nuclei is not in phase again. Transverse magnetisation vector disappears after this time. Relaxation times
To recognize signals from the different parts of the patient magnetic field gradients („gradual change“) are used e.g., a gradient of B along the z-axis allows us to identify signals coming from different slices of patient perpendicular to the z-axis. The final image is produced using similar types of image generation processes as in CT. We can visualise differences in local hydrogen density or differences in relaxation times. MRI - Magnetic Resonance Imaging.
Up to values B =0.3 T we can use giant permanent magnets (cheap but low contrast resolution). Electromagnets are stronger but need a lot of electric energy. Best contrast resolution but also the highest operational costs is obtained withmagnets having superconducting coil windings,which can produce fields of up to B = 10 T today, but must be cooled by liquid helium. Typical values of B used in practice are 1 – 3 T. Gradients(about several mT.m-1) of magnetic field are formed by additional coils. Technical aspects
Some paramagnetic atoms can amplify the signal. That is why e.g., gadolinium is used as a contrast agent for MRI. Gadolinium is chemically bound to certain pharmaceuticals e.g., DTPA - diethylen-triamin-penta-acetic acid. The exact value of the Larmor frequency changes slightly (shifts) according to the position of the hydrogen in the molecules. For example, different shifts of H in groups =CH- or -CH2- are well measurable. This allows us to identify such groups using in-vivo MR - spectroscopyis a powerful tool with application in functional MRI (analysis of ATP content etc.). MRI devices are usually adjusted to the resonance of hydrogen atoms present in water molecules. MR Contrast and MR Spectroscopy
The magnet can impair function of other medical devices. Hence MRI is strongly contraindicated in patients with some electronic devices inside their bodies (pacemakers, cochlear implants etc.) Iron objects are strongly attracted to the “gantry” – they can damage the device and cause injuries. MRI is strongly contraindicated in patients with any iron bodies inside (implants, bullets, splinters of grenades etc.) MRI is not recommended in the first trimester of pregnancy. Some minor problems can be caused by any metals inside the body or on the body surface (heating, prickling sensations). For example: jewellery, some mascaras, old tattoos, tooth fillings, dental crowns and frameworks, implants etc.) Some patients are anxious or unquiet inside the device gantry, because of strong noise during the examination. Claustrophobia is also common. Safety aspects
magnetic memories (e.g., credit cards) can be destroyed if taken into an MRI room Important Advice
„T2 weighted“ image of transversal section of head in the level of cochlea.(Siemens).
http://www.cis.rit.edu/htbooks/mri/inside.htm MR - Angiogram
3D model of curvature of left A. cerebri media (arrow) and M1 segment of the same artery (wedge)B) other view on this model shows also curvature of A. cerebri media (arrow shows a well visible aneurysm)These are not plastic models but the result of real MRI image processing! • http://splweb.bwh.harvard.edu:8000/pages/papers/shin/ns/ns.html#Outcome:
The contact-less thermographic method is based on the measurement of infrared radiation (IR) emitted by the surface of the body. Digital sensor technology is used for image recording. Wavelength 780 nm - 1 mm IR visualised first by Holst in 1934 Discovered by astronomer Herschel in 1800 The wavelength used in thermography 0.7 - 14 μm What is infrared imaging and infrared radiation?
Principle of image recording A digital camera with an IR-sensitive pixel sensor array (microbolometer). Microbolometer is a grid of vanadium oxide or amorphous silicon heat sensors atop a corresponding grid of silicon. IR radiation from a specific range of wavelengths strikes the vanadium oxide and changes its electrical resistance. This resistance change is a measure of the temperature. Temperatures can be represented graphically. The microbolometer grid is commonly found in many sizes e.g., 244 x 193 (Meditherm), 160×120 array (Fluke).
IRcamera of Dept. Of Biophysics, Faculty of Medicine, MU, Brno Fluke Ti30 Accessories
High temperature and spatial resolution Temperature distribution is displayed in the form of isothermal lines - isotherms Possibility to display temperature profiles Fast measurement IR imaging in medicine – advantages and disadvantages • Surface temperature distribution differs even in healthy people • We have always to compare temperature of symmetrical body parts • In contrast to original expectation, it is not possible to use IR imaging as a screening method for malignancies, e.g. breast tumours, because of its low specificity.
The method informs us about the extent and dynamics of any pathological process which is accompanied by increased temperature. Indications Diseases of peripheral blood vessels Diseases of thyroid Diseases of lymphatic system Joint inflammations Demarcation of burns and frostbites Assessment ob blood supply after reconstruction surgery... Clinical Importance of Thermography Imaging conditions: Temperature of darkened room 20 °C Acclimatisation time about 20 min. Examined body area must be uncovered during acclimatisation It is not allowed to smoke, drink alcoholic beverages, exercise or take drugs causing vasodilatation or vasoconstriction before examination
www.mhs5000.com/software.htm Stress fracture on football player X-ray showed no abnormality, thermography correlated well with the patients report of pain and provided justification for the more invasive test of scintigraphy which clearly showed a stress fracture in the exact location indicated by the thermogram. www.dititexas.com/page6.html
Low quality insulation of a warm water piping in area of joints (Fluke)
Ultrasonographic probe (Fluke) Probe „frozen“ 26,5 °C Probe in operation 28,3 °C
Thermal spot left by ultrasonographic probe on the forearm + cooling effect of the coupling gel (Fluke)
Ultrasound therapy application head (Fluke) Intensity 0,5 W/cm2 Head temperature 27,7 °C. Head rim temperature 29,2 °C Surrounding area 26,7 °C Intensity 2W/cm2 Head temperature 28 °C Head rim temperature 27,4 °C Surrounding area 26,7 °C
Language revision: Carmel J. Caruana Authors:Vojtěch Mornstein Carmel J. Caruana, Ivo Hrazdira Presentation design:Lucie Mornsteinová Last revision: March 2012 Last revision: March 2012