Download
1 / 10
100 likes | 123 Vues
Explore the effects of urban stormwater on water quality due to farmland conversion. Learn about impacts, data, & solutions.

E N D
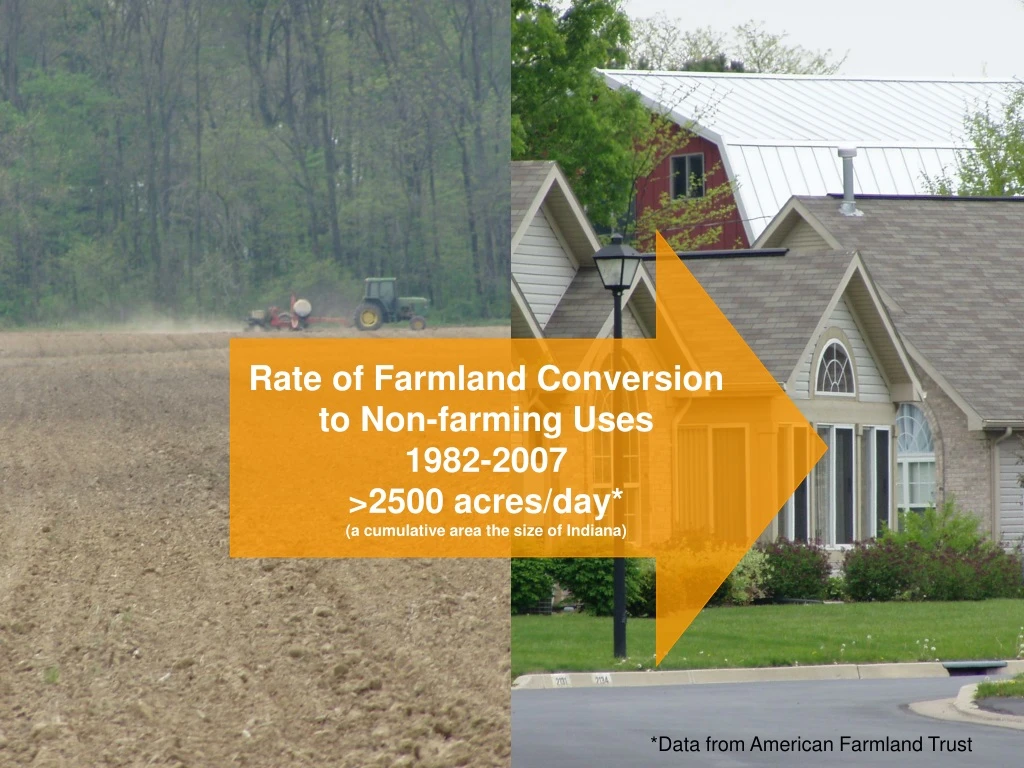
Rate of Farmland Conversion to Non-farming Uses 1982-2007 >2500 acres/day* (a cumulative area the size of Indiana) *Data from American Farmland Trust
Urban Stormwater Impacts: Quantity from Stream Corridor Restoration, produced by the Federal Interagency Stream Restoration Working Group
Rainfall data are from http://www.ncdc.noaa.gov/cag/time-series/us/33/4/pcp/1/7/1895-2016?base_prd=true&firstbaseyear=1901&lastbaseyear=2000&trend=true&trend_base=10&firsttrendyear=1895&lasttrendyear=2016for north central (Rock Creek) and northeast (Big Creek) Ohio. Runoff data are derived from U.S. Geological Survey streamflow data from http://waterdata.usgs.gov/nwis/uv?site_no=12334510(Rock Creek) and http://waterdata.usgs.gov/oh/nwis/uv?site_no=04208502(Big Creek).
Watershed System ET Soil Erosion Runoff - - Precipitation Vegetation Density Infiltration Capacity + - Impervious Cover Soil Moisture or Groundwater Storage (or Stock) Input Output
Urban Stormwater Impacts: Quality • Urban stormwater is listed as the primary source of impairment for 13% of all rivers, and 18% of all lakes (National Research Council, 2008). • In 2010, stormwater caused more than 8700 beach closings and advisory days; sewage spills and overflows caused more than 1800 beach closings and advisory days (National Research Defense Council, 2011). • Urban construction sites can result in the loss of approximately 35–45 tons of sediment per acre each year (American Society of Civil Engineers and Water Environment Federation, 1992). • Insecticides often occur at higher concentrations in urban streams than in agricultural streams (U.S. Geological Survey Circular 1225). • Total phosphorus concentrations in urban streams exceed EPA’s goal for nuisance plant growth in 70% of streams (U.S. Geological Survey NAWQA Program). • Fecal coliform bacteria commonly exceed recommended standards for water recreation (U.S. Geological Survey NAWQA Program). https://catalog.archives.gov
2011 NLCD Classification of Developed Land Cover https://catalog.archives.gov reproduced from http://www.mrlc.gov/nlcd11_leg.php
2500 ft Percent Impervious Surface


