Download
1 / 1
10 likes | 109 Vues
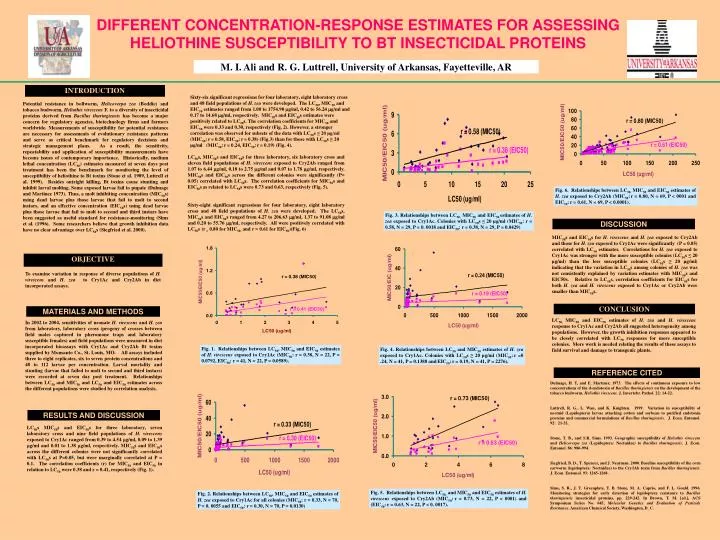
DIFFERENT CONCENTRATION-RESPONSE ESTIMATES FOR ASSESSING HELIOTHINE SUSCEPTIBILITY TO BT INSECTICIDAL PROTEINS. M. I. Ali and R. G. Luttrell, University of Arkansas, Fayetteville, AR. INTRODUCTION.

E N D
DIFFERENT CONCENTRATION-RESPONSE ESTIMATES FOR ASSESSING HELIOTHINE SUSCEPTIBILITY TO BT INSECTICIDAL PROTEINS M. I. Ali and R. G. Luttrell, University of Arkansas, Fayetteville, AR INTRODUCTION Sixty-six significant regressions for four laboratory, eight laboratory cross and 48 field populations of H. zea were developed. The LC50, MIC50 and EIC50 estimates ranged from 1.00 to 1754.90 g/ml, 0.42 to 56.24 g/ml and 0.17 to 14.68 g/ml, respectively. MIC50s and EIC50s estimates were positively related to LC50s. The correlation coefficients for MIC50 and EIC50 were 0.33 and 0.30, respectively (Fig. 2). However, a stronger correlation was observed for subsets of the data with LC50s ≤ 20 µg/ml (MIC50:r= 0.58, EIC50:r= 0.38) (Fig.3) than for those with LC50s ≥ 20 µg/ml (MIC50:r= 0.24, EIC50:r= 0.19) (Fig. 4). Potential resistance in bollworm, Helicoverpa zea (Boddie) and tobacco budworm, Heliothis virescens F. to a diversity of insecticidal proteins derived from Bacillus thuringiensis has become a major concern for regulatory agencies, biotechnology firms and farmers worldwide. Measurements of susceptibility for potential resistance are necessary for assessments of evolutionary resistance patterns and serve as critical benchmark for regulatory decisions and strategic management plans. As a result, the sensitivity, repeatability and application of susceptibility measurements have become issues of contemporary importance. Historically, medium lethal concentration (LC50) estimates measured at seven days post treatment has been the benchmark for monitoring the level of susceptibility of heliothine to Bt toxins (Stone et al. 1989, Luttrell et al. 1999). Besides outright killing, Bt toxins cause stunting and inhibit larval molting. Some exposed larvae fail to pupate (Dulmage and Martinez 1973). Thus, a molt inhibiting concentration (MIC50s) using dead larvae plus those larvae that fail to molt to second instars, and an effective concentration (EIC50s) using dead larvae plus those larvae that fail to molt to second and third instars have been suggested as useful standard for resistance-monitoring (Sims et al. (1996). Some researchers believe that growth inhibition data have no clear advantage over LC50s (Siegfried et al. 2000). LC50s, MIC50s and EIC50s for three laboratory, six laboratory cross and eleven field populations of H. virescens exposed to Cry2Ab ranged from 1.07 to 6.44 g/ml, 0.18 to 2.75 g/ml and 0.07 to 1.78 g/ml, respectively. MIC50s and EIC50s across the different colonies were significantly (P= 0.05) correlated with LC50s. The correlation coefficients for MIC50s and EIC50sas related to LC50s were 0.73 and 0.63, respectively (Fig. 5). Sixty-eight significant regressions for four laboratory, eight laboratory cross and 48 field populations of H. zea were developed. The LC50s, MIC50s and EIC50s ranged from 4.27 to 206.63 g/ml, 1.37 to 91.08 g/ml and 0.20 to 55.76 g/ml, respectively. All were positively correlated with LC50s(r = 0.80 for MIC50, and r = 0.61 for EIC50)(Fig. 6) Fig. 6. Relationships between LC50, MIC50 and EIC50 estimates of H. zea exposedtoCry2Ab (MIC50:r = 0.80, N = 69, P < 0001 and EIC50:r = 0.61, N = 69, P < 0.0001). Fig. 3. Relationships between LC50, MIC50 and EIC50 estimates of H. zea exposed toCry1Ac. Colonies with LC50s ≤ 20 µg/ml (MIC50: r = 0.58, N = 29, P =0. 0018 and EIC50: r = 0.38, N = 29, P = 0.0429) DISCUSSION MIC50s and EIC50s for H. virescens and H. zea exposed to Cry2Ab and those for H. zea exposed to Cry1Ac were significantly (P = 0.05) correlated with LC50 estimates. Correlations for H. zea exposed to Cry1Ac was stronger with the more susceptible colonies (LC50s ≤ 20 µg/ml) than the less susceptible colonies (LC50s ≥ 20 µg/ml) indicating that the variation in LC50s among colonies of H. zea was not consistently explained by variation estimates with MIC50s and EIC50s. Relative to LC50s, correlation coefficients for EIC50s for both H. zea and H. virescens exposed to Cry1Ac or Cry2Ab were smaller than MIC50s. OBJECTIVE To examine variation in response of diverse populations of H. virescens and H. zea to Cry1Ac and Cry2Ab in diet incorporated assays. CONCLUSION MATERIALS AND METHODS LC50, MIC50 and EIC50 estimates of H. zea and H. virescens response to Cry1Ac and Cry2Ab all suggested heterogeneity among populations. However, the growth inhibition responses appeared to be closely correlated with LC50 responses for more susceptible colonies. More work is needed relating the results of these assays to field survival and damage to transgenic plants. In 2002 to 2004, sensitivities of neonate H. virescens and H. zea from laboratory, laboratory cross (progeny of crosses between field males captured in pheromone traps and laboratory susceptible females) and field populations were measured in diet incorporated bioassays with Cry1Ac and Cry2Ab Bt toxins supplied by Monsanto Co., St. Louis, MO. All assays included three to eight replicates, six to seven protein concentrations and 48 to 112 larvae per concentration. Larval mortality and stunting (larvae that failed to molt to second and third instars) were recorded at seven day post treatment. Relationships between LC50 and MIC50 and LC50 and EIC50 estimates across the different populations were studied by correlation analysis. Fig. 1. Relationships between LC50, MIC50 and EIC50 estimates of H. virescens exposedtoCry1Ac (MIC50: r = 0.38, N = 22, P = 0.0792, EIC50: r = 41, N = 22, P = 0.0589). Fig. 4. Relationships between LC50 and MIC50 estimates of H. zea exposed toCry1Ac. Colonies with LC50s ≥ 20 µg/ml (MIC50:r =0 .24, N = 41, P = 0.1388 andEIC50:r = 0.19, N = 41, P = 2276). REFERENCE CITED Dulmage, H. T, and E. Martinez. 1973. The effects of continuous exposure to low concentrations of the d-endotoxin of Bacillus thuringiensis on the development of the tobacco budworm, Heliothis virescens. J. Invertebr. Pathol. 22: 14-22. Luttrell, R. G., L. Wan, and K. Knighten. 1999. Variation in susceptibility of noctuid (Lepidoptera) larvae attacking cotton and soybean to purified endotoxin proteins and commercial formulations of Bacillus thuringiensis. J. Econ. Entomol. 92: 21-32. Stone, T. B., and S.R. Sims. 1993. Geographic susceptibility of Heliothis virescens and Helicoverpa zea (Lepidoptera: Noctuidae) to Bacillus thuringiensis. J. Econ. Entomol. 86: 986-994. Siegfried, B. D., T. Spencer, and J. Nearman. 2000. Baseline susceptibility of the corn earworm (lepidoptera: Noctuidae) to the Cry1Ab toxin from Bacillus thuringiensis. J. Econ. Entomol. 93: 1265-1268. Sims, S. R., J. T. Greenplate, T. B. Stone, M. A. Caprio, and F. L. Gould. 1996. Monitoring strategies for early detection of lepidoptera resistance to Bacillus thuringiensis insecticidal proteins, pp. 229-242. In Brown, T. M. [ed.], ACS Symposium Series No. 645, Molecular Genetics and Evaluation of Pesticide Resistance. American Chemical Society, Washington, D. C. RESULTS AND DISCUSSION LC50s, MIC50s and EIC50s for three laboratory, seven laboratory cross and nine field populations of H. virescens exposed to Cry1Ac ranged from 0.39 to 4.54 g/ml, 0.09 to 1.39 g/ml and 0.01 to 1.38 g/ml, respectively. MIC50s and EIC50s across the different colonies were not significantly correlated with LC50s at P=0.05, but were marginally correlated at P = 0.1. The correlation coefficients (r) for MIC50 and EIC50 in relation to LC50 were 0.38 and r = 0.41, respectively (Fig. 1). Fig. 5. Relationships between LC50, and MIC50 and EIC50 estimates of H. virescens exposedtoCry2Ab (MIC50:r = 0.73, N = 22, P < 0001) and (EIC50:r = 0.63, N = 22, P < 0. 0017). Fig. 2. Relationships between LC50, MIC50 and EIC50 estimates of H. zea exposed toCry1Ac for all colonies (MIC50: r = 0.33, N = 70, P =0. 0055 and EIC50: r = 0.30, N = 70, P = 0.0130)

![POSITIVE RESPONSE vs [CONCENTRATION]](https://cdn0.slideserve.com/623445/slide1-dt.jpg)


![POSITIVE RESPONSE vs [CONCENTRATION]](https://cdn5.slideserve.com/9304166/positive-response-vs-concentration-dt.jpg)