Download
1 / 15
150 likes | 407 Vues
The Long Run Average Cost Curve. How to Construct the LR AC Curve. Short Run Cost Curves. A product can be produced in different ways by using different combinations of the factors of production.

E N D
The Long Run Average Cost Curve How to Construct the LR AC Curve
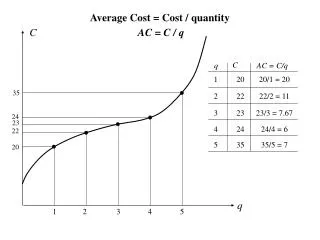
Short Run Cost Curves A product can be produced in different ways by using different combinations of the factors of production. For example, a product could be made using any given combination of the factors as shown in the table. Each of these combinations of the factors of production would be represented by a different SRAC curve …
AC Quantity Short Run Cost Curves Leading to Long Run AC Curve Each of theses SRAC curves gives a different AC for any given quantity “X”. SRAC 1 SRAC 2 SRAC 3 SRAC 4 X
AC SRAC 1 SRAC 2 SRAC 3 SRAC 4 Quantity Short Run Cost Curves Leading to Long Run AC Curve For any quantity between 91 and 180 SRAC3 gives the lowest average cost. The LRAC curve is created by combining the segments of each of the SRAC curves that gives the lowest average cost for all quantities. For any quantity up to 40, SRAC1 gives the lowest average cost. For any quantity between 41 and 90 SRAC2 gives the lowest average cost. For any quantity greater than 180 SRAC4 gives the lowest average cost. LRAC curve 90 40 180
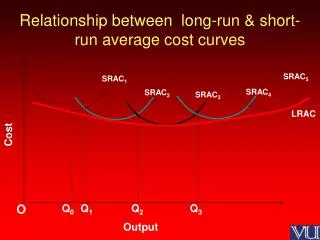
Cost SRAC 1 SRAC 2 SRAC 3 SRAC4 Quantity Short-run Cost Curves Leading to Long Run AC Curve The same theory holds true when the SRAC curves are U-shaped. Simply join the relevant segments of the various SRAC curves that give the lowest average cost for any given quantity.
The Shape of the LRAC Curve • The shape of the long run average cost curve is determined by the interaction of the economies and diseconomies of scale. • Economies of scale are the forces that decrease AC as production levels increase. • Diseconomies of scale are the forces that increase AC as production levels increase. • If the economies of scale outweigh the diseconomies of scale, AC will decrease. • If the diseconomies of scale outweigh the economies of scale, AC will increase. • If they counter balance each other, AC will not change.
Economies and Diseconomies of Scale Economies and diseconomies of scale aresub-divided into: • internal economies of scale • internal diseconomies of scale • external economies of scale • external diseconomies of scale.
Internal Economies and Diseconomies of Scale Internal economies of scale are those forces within the firm that decrease AC as the size of the firm increases. Internal diseconomies of scale are those forces within the firm that increase AC as the size of the firm increases.
Internal Economies of Scale • Financial economies of scale. • Economies of construction. • Economies arising from specialisation of machinery. • Economies arising from specialisation of labour. • Purchasing economies of scale. • Marketing economies of scale. • Distribution economies of scale.
Internal Diseconomies of Scale • Managerial diseconomies. • Lack of morale of employees. • A high proportion of “non productive” employees.
External Economies and Diseconomies of Scale External economies of scale are those forces outside the firm that decrease AC as the size of the industry increases. External diseconomies of scale are those forces outside the firm that increase AC as the size of the industry increases.
External Economies of Scale • Specialisation of production of components. • As an industry expands in size more service industries spring up around it. • As an industry expands educational and training institutions are established to provide the skilled workers required by the industry. • Specialised research and development firms will be established to service the growing industry. • As an industry grows the government may be encouraged to improve the national infrastructure.
External Diseconomies of Scale • As an industry expands it could suffer from a shortage of raw materials. • As output increases in an industry the supply of the skilled workforce required may not keep up with the demand. • The expansion of the infrastructure may not keep pace with the expansion of the industry.
Price Quantity Shape of Long Run AC Curve When economies of scale outweigh diseconomies of scale. AC AC When economies and diseconomies of scale counter balance. When diseconomies of scale outweigh economies of scale.