Download
1 / 23
230 likes | 514 Vues
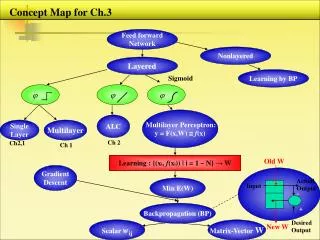
Depletion Performance of Poorly Stimulated Layered Reservoirs Without Crossflow. T. F. McCoy D. E. Reese P. G. Johnson Phillips Petroleum Company. Introduction. Layered no-crossflow reservoirs Poor initial completions Single well / competitive reservoirs Potential rate and reserve increases

E N D
Depletion Performance ofPoorly StimulatedLayered ReservoirsWithout Crossflow T. F. McCoyD. E. ReeseP. G. JohnsonPhillips Petroleum Company
Introduction • Layered no-crossflow reservoirs • Poor initial completions • Single well / competitive reservoirs • Potential rate and reserve increases • Guidelines for selecting restimulation candidates • Case histories
Purpose of Paper • Quantify opportunity for increasing production and reserves through identification of a poor completion on low permeability layer(s) • Emphasize the penalty for failing to recognize the potential of the low permeability layers
Forecasts • 100 cell, 2D radial model • Parameters identical to Fetkovich • Layer 1 … 10 md Layer 2 … 1 md • Bottomhole flowing pressure of 42.8 psia • Abandonment rate 10 MSCFD
Pressure vs. Cumulative Production • Skin = 0, 3, 5, 10, 25, 50 (low perm layer) • VR = 1/2 = 0.5 BSCF / 1.0 BSCF • KR = K1/ K2 = 10 md / 1 md
Material Balance 500 Case 1, S1 = -3, S2 = -3 Case 2, S1 = -3, S2 = 50 Case 3, S1 = -3, S2 = 50, -3 Case 2 Economic Limit 400 KR = K1 / K2 = 10/1 VR = V1 / V2 = 1/2 300 Layer 2 Pressure / Z, psia Case 1 & 3 Economic Limit Layer 1 200 Total System 100 Pwf / Z = 43.2 0 0 0.5 1 1.5 Cumulative Production, GpT, BSCF
Recovery vs. Low Permeability Layer Skin at Abandonment( KR = 10/1, VR = 1/2) Layer 1 (10 md) Layer 2 (1 md) Total Case RF,% p/z, psia RF, % p/z, psia RF,% 42.5 90.9 203.8 56.7 68 1,3 54.5 88.3 438.7 6.6 34 2
Recovery vs. Low Permeability Layer Skin at Abandonment( KR = 10, VR = 1/5) Layer 1 (10 md) Layer 2 (1 md) Total Case RF,% p/z, psia RF, % p/z, psia RF,% 41.5 91.0 204.9 58.4 62.4 1,3 52.5 89.3 455.8 3.4 17.3 2
Rate vs. Time 1,000 Restimulation case, Layer 1 Restimulation case, Layer 2 Restimulation case, Total Proper initial stimulation Poor initial stimulation Restimulation 100 Gas Rate, MSCF / Month 10 1 0 10 20 30 40 50 60 70 Time, Years
Abandonment Rate 100 Layer 1, high perm 90 Layer 2, low perm 80 Total Well 70 60 Recovery Factor, % 50 40 30 20 10 0 0 20 40 60 80 100 Abandonment Rate, MSCF/D
Field Shut-in Pressures 500 Case 1, S1 = -3, S2 = -3 Case 2, S1 = -3, S2 = 50 Case 3, S1 = -3, S2 = 50, -3 400 300 Pressure / Z, psia Restimulation 200 100 0 0.5 1 1.5 Cumulative Production, GpT, BSCF
Competition 500 Well A, poor stimulation Well B, restimulated 400 300 Restimulation Pressure / Z, psia 200 100 0 0 0.5 1 1.5 Cumulative Production, GpT, BSCF
Layer 1 (10 md) Layer 2 (1 md) Total Case RF, % RF,% p/z, psia p/z, psia RF,% Well A 55.5 88.0 426.6 6.1 33.3 114.3 Well B 50.5 175.5 98.2 105 Interference Effects, Recovery vs.Low Permeability Layer Skin at Abandonment ( KR = 10, VR = 1/2)
Guidelines • Review well file • Completions with no diversion • Review porosity and saturation cutoffs • Review offset well files • Review production history (rate, pressure) • Run production logs to identify non-producing intervals • Decline curve analysis • Individual layer transient testing
Example Well A 1,000 Restimulation 100 Gas rate, MSCFD 10 85 87 89 91 93 95 97 99 Time, Year
Restimulation Example Well A 3,000 2,500 2,000 Wellhead Shut-in Pressire, psia 1,500 1,000 500 0 0 200 400 600 800 1000 Gas Cumulative Production, MMSCF
Recompletion Example Well B 10,000 1,000 Gas Rate, MMSCFD 100 10 66 70 74 78 82 86 90 94 98 Time, Year
Example Well B 500 400 300 Recompletion Wellhead Shut-in Pressure, psia 200 100 0 0 2 4 6 8 10 12 Gas Cumulative Production, BCF
Conclusions 1. In a single-well reservoir, the layer skin at abandonment controls the recovery factor and the layer abandonment pressure. 2. In non-competitive reservoirs, the time at which the low permeability layer skin is brought to the same level of stimulation as the high permeability layer does not affect the recovery factor and the layer abandonment pressure.
Conclusions 3. If the low permeability layer is never effectively stimulated, significant volumes of gas will be left in the low permeability layer. 4. At early time, the production rate does not allow an assessment of the level of stimulation on the low permeability layer.
Conclusions 5. Due to the long producing life and the low decline rates late in life, the abandonment rate plays a significant role in the total recovery from layered no-crossflow reservoirs. 6. The wellhead shut-in pressure is not diagnostic regarding the level of stimulation on the low permeability layer.
Conclusions 7. In competitive reservoirs, failure to effectively complete the low permeability layer can result in a significant loss of reserves to offset wells with effective low permeability layer completions. 8. Guidelines for identifying potential fracture restimulation candidates are presented. The most important place to start is the well file specifically looking for completions with no diversion and/or layers not initially completed.