Download

1 / 15
150 likes | 171 Vues
Learn how to effectively navigate the IEEE OU Analytics dashboards to access valuable information about memberships, subscriptions, and more. Utilize interactive features and filters to enhance your data exploration experience.

E N D
IEEE OU Analytics • http://www.ieee.org/ouanalytics • Sign in • IEEE web Account User Name and Password
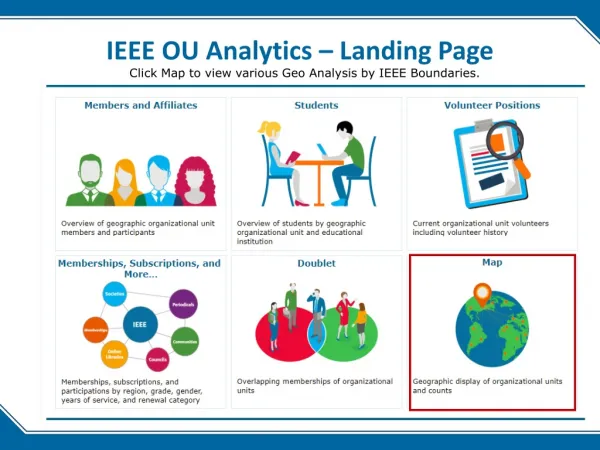
IEEE OU Analytics • The landing page is divided into areas dependent on the information required. • Members and Affiliates – provides an overview of the geographic organizational unit (OU) and members. This area would be most useful for Geographic Units such as Regions, Councils, Sections and Subsectionsto view information regarding their IEEE members. • Memberships, Subscriptions and More … provides information regarding memberships, subscriptions, and participations by region, grade, gender, years of service and renewal category. This area would be most useful for society, council, community and affinity group users to find their members. Societies and Geo Units can also view information regarding renewals and years of service for their members. • Students – provides an overview of attending students (all grades) by OU and School. • Doublet – provides a IEEE wide view of overlapping memberships • Volunteer Positions – lists of current OU volunteers including volunteer history. • Map – Geographic display of organizational units and counts • How to navigate the new Landing Page
IEEE OU Analytics • On the dashboard pages (example: “Members and Affiliates” link.) users will see . . . • How to navigate the new dashboards
IEEE OU Analytics • The breadcrumb bar appears at the top left of the screen and provides the navigation path. Clicking within the breadcrumb allows you to navigate back to a prior screen. • Most dashboard views contain several visualizations of data including information such as Count by Region, Grade, Gender, Product type or name, and Renewals with a link to Member Details. • Each display is interactive and allows you to see more, less or different information by using drop-down filters, hovering over, or clicking on chart elements. • Drop-down filter options vary depending on the content in the dashboard. Use drop-down filters to modify the results displayed in all the visualizations for that dashboard. • Navigating the Dashboards . . .
IEEE OU Analytics • To filter data using the drop-down menu • Click on the desired drop-down filter • Click All to deselect all filters • Click items you want to filter on (ex. Regions 2, 4, 6) • Click on Apply and then click on any white space to close the filter box. • Navigating the Dashboards . . .
IEEE OU Analytics • Interacting with Content – Filtering Within a Visualization • In addition to drop-down filters, users can filter data directly from the visualization. • Click on the data point on the chart you wish to explore. The selected data • Navigating the Dashboards . . . area will open and will be automatically filtered. (Example: on the “Count by Grade” pie chart in “Memberships, Subscriptions, and More – click on the GSM slice. You will see only GSM’s displayed on the chart and counts in the table also reflect GSM’s only.
IEEE OU Analytics • Tool Tip: Provides another option for filtering visualizations. Click on the data point and then hover over the filtered area. A tool tip will appear and you can choose one of the following: • Keep only – keeps the selected data in the view, all other data will be removed. • Exclude – excludes the data from the view, all other data will be retained. • View Detail – launches Detail View, which provides a list of the chosen data with detail information. • Navigating the Dashboards . . . • To clear the filter in the Tool Tip, click “Undo” at the top of the page and then click within white space to return the visualization to its original display.
IEEE OU Analytics • Various visualizations provide an option to expand or collapse columns. This can be done before or after applying filters. • Example: The “Renewal Category by Region by Grade” tab in the Memberships, Subscriptions, and More Dashboard allows for the expansion of the “Region” column to display counts by GeoCouncil and Section within the Summary by Product by Region visualization. • Navigating the Dashboards . . .
IEEE OU Analytics • Expanding or Collapsing Columns: Hover over column headings of a data table to see the expand and collapse buttons, if available. • Click the plus sign to expand the column • Click the minus sign to collapse the column; the plus sign will then appear • Click Revert button to return to where you started. • Navigating the Dashboards . . .
IEEE OU Analytics • Undo changes • Use the Undobutton to reverse back through the changes you’ve made to the view. It will remember each step and undo one at a time. • Navigating the Dashboards . . . • Revert • Use the Revert button to restore filters to original view maintained on dashboard. This action reverts all dashboards to original view and removes all changes/selections made to filters.
IEEE OU Analytics • Tableau provides many tools for displaying, filtering, and manipulating data. However, if you need to download, there are several options found under the Download button. • To download the data for a pie chart, for example, click on the title of the pie chart. Then click on the Download button on the top right of the screen. The following options will appear: • Image – downloads the image on your screen to a png file. • Data – (not recommended) downloads the data to a csvfile. This option requires multiple steps for downloading to a text file and does not retain format. • Crosstab – (recommended download option) downloads the data to a csv file. • PDF – downloads the image on the screen to a PDF file. • Downloading Data • Important note, if you do not select the title of the visualization before clicking Download, the data and crosstab options will be grayed out.
IEEE OU Analytics • Examples: • Crosstab: Data downloaded from Pie Chart View. • Data: Data downloaded from Table View will first display a screen titled Summary. Click on the link “Download all rows as a text file” to download into a csv file. • When completed, it will download a csv file. • Downloading Data
IEEE OU Analytics • If you have any questions regarding the new tool or need further assistance send an email to ouanalytics@ieee.org • Here are additional contacts: • Questions & Assistance GEOGRAPHIC ORG UNITS CONTACTS Helen Shiminsky (primary) Email: h.shiminsky@ieee.org +1 732 562 5517 Vera Sharoff (alternate) Email: v.sharoff@ieee.org +1 732 552 5509 SOCIETY ORG UNITS CONTACTS Mary Curtis (primary) Tina Cordeiro (pimary) Email: m.curtis@ieee.org t.cordeiro@ieee.org +1 732 562 3904 +1 732 562 5329 Rosanne Loyal (alternate) Email: r.loyal@ieee.org +1 732 562 3903