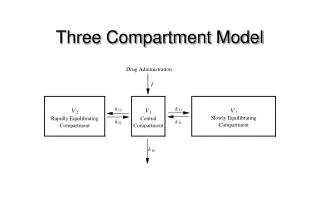
Three-Level Models and Their Applications
Explore the concept of three-level models in statistical research, including classification diagrams, dataframes, algebraic specifications, VPC forms, and model applications in educational settings. Learn how to specify models in MLwiN and understand variance partition coefficients to analyze correlations in multilevel data. Discover examples of multilevel analyses in different research fields to gain insights into the complexities and benefits of three-level modeling.

Three-Level Models and Their Applications
E N D
Presentation Transcript
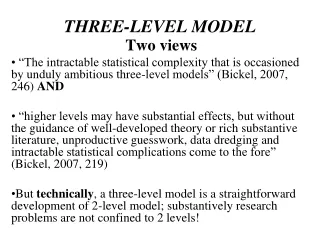
THREE-LEVEL MODEL Two views “The intractable statistical complexity that is occasioned by unduly ambitious three-level models” (Bickel, 2007, 246) AND “higher levels may have substantial effects, but without the guidance of well-developed theory or rich substantive literature, unproductive guesswork, data dredging and intractable statistical complications come to the fore” (Bickel, 2007, 219) But technically, a three-level model is a straightforward development of 2-level model; substantively research problems are not confined to 2 levels!
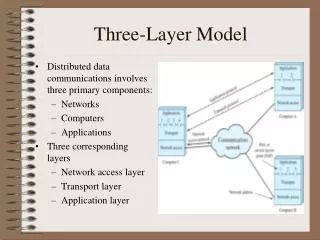
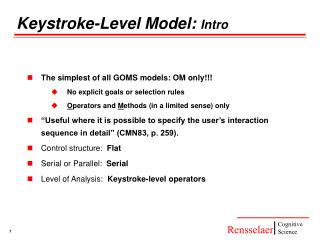
THREE-LEVEL MODEL |Unit and classification diagrams, dataframes Some example of applied research Algebraic specification of 3 level random-intercepts model Various forms of the VPC Specifying models in MLwiN Residuals Applying the model - the repeated cross-sectional model; changing school performance Further levels: - as structures etc - in MLwin
School Sc1 Sc2 Sc3 Class C1 C2 C1 C2 StudentSt1 St2 St3 St1 St2 St1 St2 St3 St1 St2 St3 St4 School Class Student Three-level modelsUnit and classification diagrams • Student achievement affected by student characteristics, class characteristics and school characteristics • Need more than 1 class per school; imbalance allowed • Need lots of pupils in lots of classes in lots of schools!
Data Frame for 3 level model NB must be sorted correctly for MLwiN, recognises units by change in higher-level indices
Some examples (with references) • West, B T et al (2007) Linear mixed models, Chapman and Hall, Boca Raton • Dependent variable: student’s gain in Maths score, kindergarten to first grade • Explanatory variables • 1: Student (1190): Maths score in kindergarten, Sex, Minority, SES • 2: Classroom (312) Teacher’s years of teaching experience, Teacher’s maths experience, teacher’s maths knowledge • 3: School (107) % households in n’hood of school in poverty NB lacks power to infer to specific classes/schools?
Some examples continued • Bickel, R (2007) Multilevel analysis for applied research, Guildford Press, New York • Dependent variable: Maths score for 8th graders in Kentucky • Explanatory variables • 1: Student (50,000): Gender, Ethnicity, • 2: Schools (347) School size, % of school students receiving free/reduced cost lunch • 3: Districts (107) District school size
Some examples continued • Ramano, E et al (2005) Multilevel correlates of childhood physical aggression and prosocial behaviour Journal of Abnormal Child Psychology, 33, 565-578 • individual, family and neighbourhood • Wiggins, R et al (2002) Place and personal circumstances in a multilevel account of women’s long-term illness Social Science & Medicine, 54, 827-838 - Large scale study, 75k+ women in 9539 wards in 401 districts; used PCA to construct level-2 variables from census data
Correlation structure of 3 level model Intra-class correlation (within same school & same class) r1 Intra-school correlation (within same school, different class) r2
Example: pupils within classes within schools (Snijder & Bosker data)
Variance Partition Coefficients: pupils within classes within schools (Snijder & Bosker data)
Specifying models in MLwiN • Three-level variance components for attainment
Specifying models in MLwiN • Are there classes and/or schools where the gender gap is large, small or inverse? • Student gender in fixed part and Variance functions at each level Level 3 variance Level 2 variance Level 1 variance
Specifying models in MLwiN • Is the Gender gap differential according to teaching style? • Cross-level interactions between Gender and Teaching style in the fixed part of the model • IE main effects for gender & style, and first order interaction between Student Gender and Class Teaching Style Fixed part Cons: mean score for Male in Formally-taught class Female: differential for female in formal class Informal: differential for male in informal class Female*Informal: differential for female in informal class
Residuals • Key notion is that highest level residual is a random, allowed-to-vary departure from general relationship • Each lower level residual is allowed-to-vary random departure from the higher-level departure
Level 2 residuals: class departures from the associated school line
Level-1 residuals: student departures from the associated class line
Sc1 Sc2 Sc3.... 1985 1986 1987 1985 1987 1986 1987 St1…St9 St1… St25 St1 …St32 St1… St22 St1… St12 St1… St29 St1… St13 Applying the model: the repeated cross-sectional model; changing school performance School Cohort Student • Modelling Exam scores for groups of students who entered school in 1985 and a further group who entered in 1986. • In a multilevel sense we do not have 2 cohort units but 2S cohort units where S is the number of schools. • The model can be extended to handle an arbitrary number of cohorts with imbalance
Applying the model: the repeated cross-sectional model; changing school performance • Modelling Exam scores aged 16 for Level 3 139 state schools from the Inner London Education Authority, Level 2 304 cohorts with a maximum of 3 cohorts in any one school, and Level 1 115,347 pupils with a maximum of 135 pupils in any one school cohort • pupil level variables: Sex, Ethnicity, Verbal Reasoning aged 11 • cohort-level variables: % of pupils in each school who were receiving Free-school meals in that year, % of pupils in the highest VRband in that year, the year that the cohort graduated • school level variables: the ‘sex’ of the school (Mixed Boys and Girls); the schools’ religious denomination (Non-denominational, CofE, Catholic)
Sc1 Sc2... School Cohort 1990 1991 1990 1991 student Msmnt occ • Some examples of 4-level nested structures: • student within class within school within LEA • people within households within postcode sectors within regions • Finally, Repeated measures within students within cohorts within schools Further levels - as structures, etc St1 St2... St1 St2.. St1 St2.. St1 St2.. O1 O2 O1 O2 O1 O2 O1 O2 O1 O2 O1 O2 O1 O2 O1 O2 Cohorts are now repeated measures on schools and tell us about stability of school effects over time Measurement occasions are repeated measures on students and can tell us about students’ learning trajectories.
Further levels - in MLwiN • Click on extra subscripts! • Default is a maximum of 5 but can be increased