Download
1 / 17
170 likes | 304 Vues
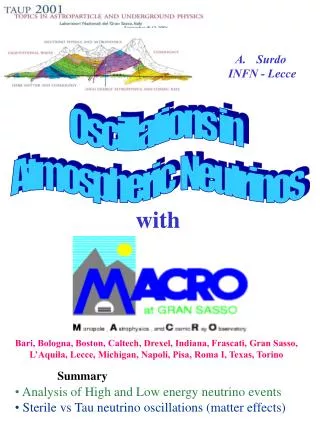
Surdo INFN - Lecce. Oscillations in Atmospheric Neutrinos. with. Bari, Bologna, Boston, Caltech, Drexel, Indiana, Frascati, Gran Sasso, L’Aquila, Lecce, Michigan, Napoli, Pisa, Roma I, Texas, Torino. Summary Analysis of High and Low energy neutrino events

E N D
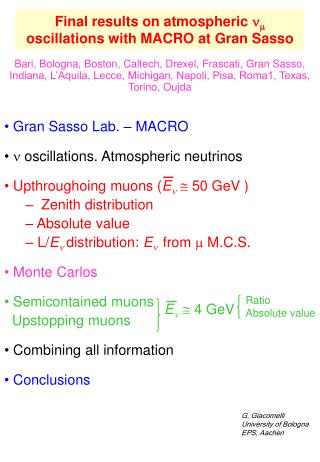
Surdo • INFN - Lecce Oscillations in Atmospheric Neutrinos with Bari, Bologna, Boston, Caltech, Drexel, Indiana, Frascati, Gran Sasso, L’Aquila, Lecce, Michigan, Napoli, Pisa, Roma I, Texas, Torino • Summary • Analysis of High and Low energy neutrino events • Sterile vs Tau neutrino oscillations (matter effects)
MACRO @ Gran Sasso • GUT Monopole and rare particle search • Cosmic ray physics • Neutrino bursts from stellar collapses • Study of atmospheric neutrinos • Neutrino astronomy • Indirect search for WIMPs Data taking: Mar 1989 – Dec 2000 (complete detector since Apr ’94)
Neutrino event topologies in MACRO In up Up through Absorber Streamer Scintillator In down (2) (1) Up stop (4) (3) • Detector mass ~ 5.3 kton • (1) Up throughgoing m(ToF) • (2) Internal Upgoing m (ToF) • (3) Internal Downgoing m(no ToF) • (4) UpGoing Stopping m (no ToF)
Energy spectra of n events detected in MACRO • Emedian ~ 50 GeV for Throughgoing muons; • Emedian~ 4.5 GeV for Internal Upgoing (IU) m; • Emedian~ 3.5 GeV for Internal Downgoing (ID) m and for UpGoing Stopping (UGS) m; Low energy events (IU, ID+UGS) allow to investigate the n oscillation parameter space independently from throughgoing muons
Upward Throughgoing muons Analysis and Data Set Event selection based on time-of-flight method *b evaluation: T3 T4 +1 m L>2.5m Streamer tube track -1 m T1 T2 * Background rejection cuts: • 1) agreement between streamer track and scintillator • counter hits (position from times at the ends) • 2) -1.25 < 1/b < -0.75 • 3) 2m (~200 g/cm2) of absorber crossed to reduce at 1% level the • bck due to p’s produced by muons (Astrop. Phys. 9 (1998) 105) • Automated data selection procedure (no visual scan) • 863 n induced upward through-going muons during: Mar 89-Nov 91 (1.4y)Dec 92-Jun 93 (0.4y)Apr 94-Dec 2000 (5.5y) 1/6 lower detector Lower detectorComplete detector Phys. Lett. B357 (1995) 481Phys. Lett. B434 (1998) 451 (until Nov ‘98)
Measured flux and comparison with Monte Carlo • Data • number of events: 863 • background (wrong b) 22.5 • background (p’s from muons) 14.2 • Internal neutrino interactions 17 • Total 809 events • Monte Carlo prediction1122 ± 17% • - Bartol atmospheric neutrino Flux(±14%) • - GRV-LO-94 PDF for DIS cross section(± 9%) • - Lohmann et al. muon energy loss (± 5%) • * Detector response simulation using GEANT • * Same analysis chain as the data R = data/prediction = 0.721 ± 0.026stat ± 0.043syst ± 0.122theor
Upward Through-Going Muons Angular Distribution 2 test on the angular distribution (10 bins) with prediction normalized to data : • 2 = 9.6/9 d.o.f for with maximum mixing and m2 ~ 0.0025 eV2P = 37 % • 2 = 25.9/9 d.o.f. for no - oscillations P = 0.2 %
MACRO UPMU Probabilities for sterile neutrino oscillations • Sterile neutrino matter effects • reduction of angular distortion (max mixing) P.Lipari and M.Lusignoli, hep-ph/ 9803440 Q.Y.Liu et al, PLB440 (1998) 319, Peak probability for the shape = 1.8% Peak probability for the combination = 8% Max mixing Probabilities lower than that for t neutrinos
Ratio vertical / horizontal Lipari -Lusignoli, Ph Rev D57 (1998) Monte Carlo optimized: • The plot is for maximum mixing • P(sterile) = 0.033% • P(t) = 8.4% • Sterile neutrino disfavored with respect to t at • >99% C.L. for any mixing(7% systematic on the ratio) (Results in hep-ex/0106049, to be published on Phys. Lett.,)
Partially contained events Phys. Lett. B478 (2000) 5 Selection criteria: Internal Upgoingm’s(IU) (a)time-of-fligthbetween central / top SC layers (b)topological criteria forvertex containment inside lower detector(~1 % bck after this cut) Internal Downgoing m’s(ID) + Upgoing Stopping m’s(UGS) ID UGS (a) No T.o.F. measurement (b) topological constraints on track (bottom SC layer + track inside fiducial volume) (c) visual scan procedure for final selection (d) >100 g cm-2 of material crossed in the detector
IU events From MC simulation: • En ~ 5 GeV • ~ 87% due to m -CC interactions DATA: 5.5 live-y • From Apr. 1994 up to Dec. 2000 • 1/b distribution after all analysis cuts: DATA - Bck(1/b) = 154 events
Data vs Monte Carlo Predictions • GEANT based program for the simulation • of detector response • Simulated events processed through • the same analysis chain as the data • Fn: Bartol n flux with geomagnetic cutoffs • (error ~ 13%) • sn = Q.E. + 1p(Lipari et al., PRL74 (1995) 4384) • + DIS (GRV-LO-94 PDF) (error ~ 15%) • e(Em,qzenith):detector response and acceptance • (systematic error ~ 10 %) Internal Upward going m’s DATA: 154 ± 12stat MC: 285 ± 28sys± 57theo MC-oscill: 168 ± 17sys± 34theo Internal down + Upgoing stopping m’s DATA: 262 ± 16stat MC: 376 ± 38sys± 76theo MC-oscill: 284 ± 28sys± 57theo
Angular Distributions MC expectation (no oscillations) maximal mixing ,m2 = 2.5 x 10⁻³ eV 2 • Data consistent with a constant deficit in all • zenith angle bins (IU: 2 /d.o.f. = 3.1/4 on shape) • Probability for NO oscillations (one side): • RIU: ~ 2.3%R(ID+UGS) ~ 9.3%
Ratio of event types at low energy Internal Upgoing R = Internal Downgoing Upgoing Stop + • Most of the theor. uncertainties canceled (<5%) • Systematic errors reduced (~6%) • Data: R = 0.59 ± 0.06stat • Expected (No oscillations): R = 0.76 ± 0.04sys ± 0.04th • >>> compatibility ~ 1.9% • Expected oscillations: R = 0.59 ± 0.04sys ± 0.03th • (maximal mixing andm2 = 2.5 x 10⁻³ eV2 )