Frequency Table
Frequency Table. Frequency tables are an efficient method of displaying data The number of cases for each observed score are listed Scores that have 0 cases are included as well. Cumulative Frequency .

Frequency Table
E N D
Presentation Transcript
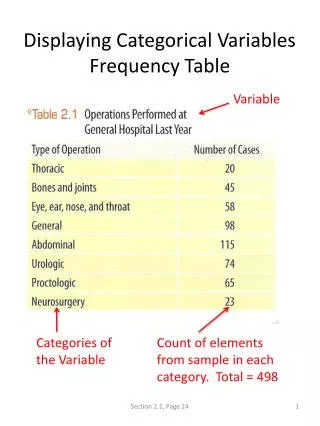
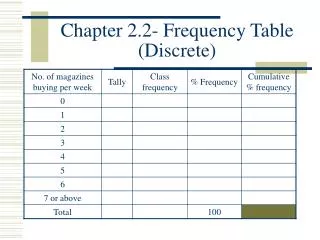
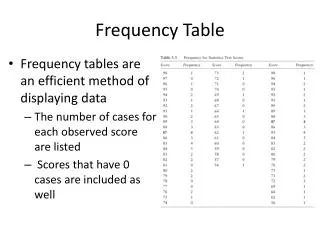
Frequency Table • Frequency tables are an efficient method of displaying data • The number of cases for each observed score are listed • Scores that have 0 cases are included as well
Cumulative Frequency • Cumulative Frequency tables add an additional column that includes the number of scores that are at or below a given score
Relative Frequency / Percentage • Relative Frequency tables include the proportion (percentage) of a given case relative to the whole data set
Grouped Frequency Table • Grouped Frequency tables organize scores in to intervals (a range of scores) • The frequency table is then created with these intervals
Percentile Rank • Percentile Ranks indicate the percentage of cases falling at or below a given score