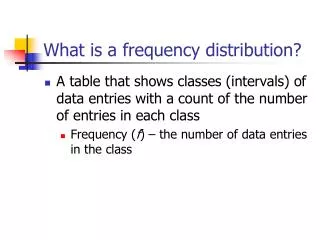
Frequency Distribution Table
Frequency Distribution Table. Relative, cumulative: frequency. Percentile. The pth percentile of a distribution is the value such that p percent of the observation fall at or below it. 80% of the people who took the test earned scores that were less than or equal to your score.


Frequency Distribution Table
E N D
Presentation Transcript
Frequency Distribution Table Relative, cumulative: frequency
Percentile The pth percentile of a distribution is the value such that p percent of the observation fall at or below it.
80% of the people who took the test earned scores that were less than or equal to your score. Standardized test scores Roberto received his ACT score and it says he’s in the 80th percentile. What does that mean?
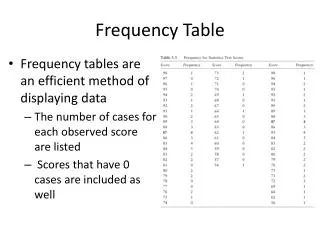
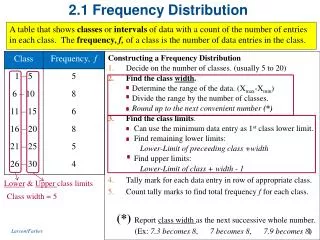
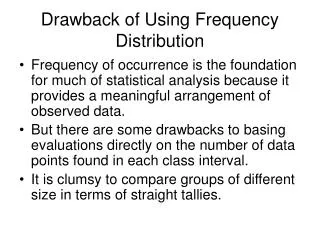
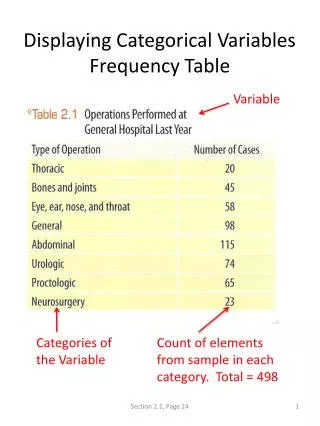
Frequency distribution A tabulation of the number of individuals in each category on the scale of measurement. Frequency Distribution Table
42 to 69 Class width of 5 from 40-44, 45-49... Presidential Ages at Inauguration 1. Get the range of the ages of the presidents 2. Decide on what class size to use 3. Construct your frequency distribution table
Constructing your OGIVE OGIVE: Relative Cumulative Frequency Graph Was Bill Clinton a young president? According to our ogive, it shows that Clinton’s age places him at the 10% RCF mark. Therefore Clinton was younger than about 90% of all the US presidents based on his inauguration age.
Let’s find the distribution of the height of all the students in room 34 during this period.
Range: Class width and size: Your turn! Height of 2011-2012 AP Statistics Students of BHS 73 - 59 = 14 Width: 3 Size: 58-60; 61-63; 64-66; 67-69; 70-72; 73-75
center Individuals variables categorical quantitative Dotplots Stemplots histogram percentile spread shape skewness outlier ogive FDT Individuals Vocabulary Summary
Statistical tools • Describing SOCS and skewness • Constructing dotplots and stemplots • Describing the SOCS of your distribution • Creating histogram • Generating histogram using graphing calculator • Organizing data by FDT • Constructing ogive and finding percentile using ogive.