Frequency Distribution
Frequency Distribution. Objectives: Create Frequency Distributions Analyze Frequency Distribution. What is a Frequency Distribution?. Allows us to understand and interpret the nature of the distribution of a data set.


Frequency Distribution
E N D
Presentation Transcript
Frequency Distribution Objectives: Create Frequency Distributions Analyze Frequency Distribution
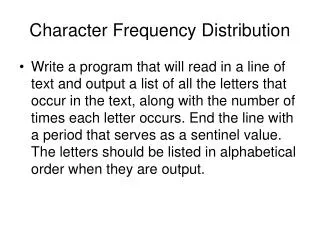
What is a Frequency Distribution? • Allows us to understand and interpret the nature of the distribution of a data set. • Shows how data is partitioned among classes by listing the classes along with the number of data values in each.
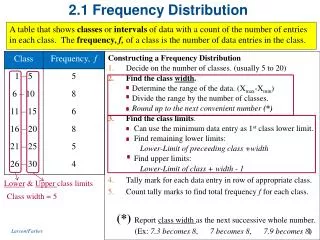
Creating a Frequency Distribution Table • Lower Class Limits: smallest numbers that can belong to the different classes • Upper Class Limits: largest numbers ... • Class Boundaries: numbers used to separate the classes, but w/out the gaps created by class limits • Class Midpoints: values in the middle of the classes • Class width: difference b/w 2 consecutive lower/upper class boundaries
Procedure: • Determine the number of classes • Will either be given or found by • ALWAYS ROUND UP!
Calculate the Class Width • Round up for convenience
Lower Class Limit • Select either the lowest data value or a convenient value below the minimum as the first lower class limit.
Cont... • Using the class width and the first lower class limit begin listing the lower class limits in a vertical column by adding the class width.
Adding the upper class limits • Identify the corresponding upper class limits to each class making sure that the classes do not overlap
Finish by... • Taking the total values in each class and listing them is column number 2
Things to watch out for: • Confusing the class width and the class boundaries • Class width is the difference between lower or upper class limits! • Make sure you include all classes, even those with 0 data values. • The sum of column 2 should be the # of values in data set
Example using Female Pulse Rates • Step 1: Find total # of classes • n=40 • Round up: There are 7 classes
Begin filling in table • Choose 60 as the first lower class limit because it is both the minimum value and a convenient value • Add the class width and record in following rows
Identify corresponding UCL • Make sure you leave no gaps where numbers would fit in.
Finish by... • Calculating frequency for each class • All values should be included totals should match up!
Relative Frequency Tables • Same Classes • Sum must be close to 1
Cumulative Frequency • Replace lower class limits with “less than...” • Add each cell to previous cells
Interpreting Frequency Distributions Normal Distribution (Bell Curve) within a frequency distribution table: Frequencies start low, increase in frequency, then return to low. Distribution is approximately symmetric