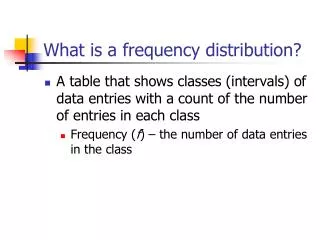
Frequency Distribution (or Frequency Table)
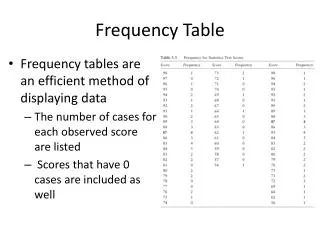
Frequency Distribution (or Frequency Table) shows how a data set is partitioned among all of several categories (or classes) by listing all of the categories along with the number (frequency) of data values in each of them. Definition. IQ Scores of Low Lead Group. Lower Class Limits.


Frequency Distribution (or Frequency Table)
E N D
Presentation Transcript
Frequency Distribution(or Frequency Table) shows how a data set is partitioned among all of several categories (or classes) by listing all of the categories along with the number (frequency) of data values in each of them. Definition
IQ Scores of Low Lead Group Lower Class Limits are the smallest numbers that can actually belong to different classes.
IQ Scores of Low Lead Group Upper Class Limits are the largest numbers that can actually belong to different classes.
IQ Scores of Low Lead Group 49.5 69.5 89.5 109.5 129.5 149.5 Class Boundaries are the numbers used to separate classes, but without the gaps created by class limits.
IQ Scores of Low Lead Group 59.5 79.5 99.5 119.5 139.5 Class Midpoints are the values in the middle of the classes and can be found by adding the lower class limit to the upper class limit and dividing the sum by 2.
IQ Scores of Low Lead Group 20 20 20 20 20 Class Width is the difference between two consecutive lower class limits or two consecutive lower class boundaries.
1. Large data sets can be summarized. 2. We can analyze the nature of data. 3. We have a basis for constructing important graphs. Reasons for Constructing Frequency Distributions
includes the same class limits as a frequency distribution, but the frequency of a class is replaced with a relative frequencies (a proportion) or a percentage frequency ( a percent) class frequency relative frequency = sum of all frequencies class frequency percentage frequency = 100% sum of all frequencies Relative Frequency Distribution
Cumulative Frequency Distribution Cumulative Frequencies
Critical Thinking: Using Frequency Distributions to Understand Data In later chapters, there will be frequent reference to data with a normal distribution. One key characteristic of a normal distribution is that it has a “bell” shape. • The frequencies start low, then increase to one or two high frequencies, and then decrease to a low frequency. • The distribution is approximately symmetric, with frequencies preceding the maximum being roughly a mirror image of those that follow the maximum.
Gaps • Gaps • The presence of gaps can show that we have data from two or more different populations.
Example • The table on the next slide is a frequency distribution of randomly selected pennies. • The weights of pennies (grams) are presented, and examination of the frequencies suggests we have two different populations. • Pennies made before 1983 are 95% copper and 5% zinc. • Pennies made after 1983 are 2.5% copper and 97.5% zinc.
Example (continued) The presence of gaps can suggest the data are from two or more different populations.