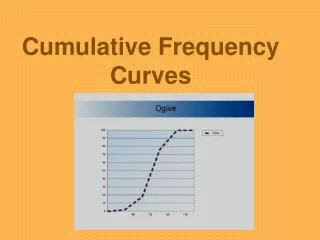
Cumulative frequency
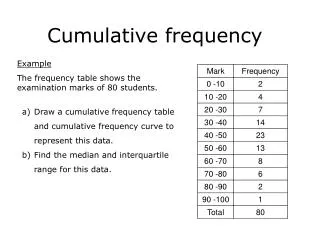
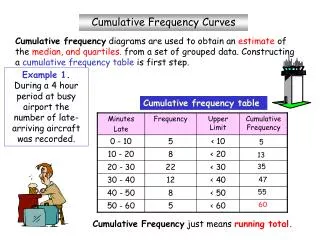
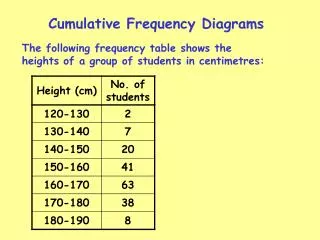
Cumulative frequency. Constructing a cumulative frequency table Using a cumulative frequency graph to construct a box and whisker diagram. A golf club has 200 members. Their ages are shown in the frequency table below.


Cumulative frequency
E N D
Presentation Transcript
Cumulative frequency Constructing a cumulative frequency table Using a cumulative frequency graph to construct a box and whisker diagram
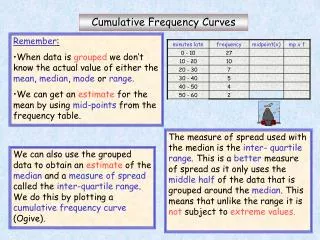
A golf club has 200 members. Their ages are shown in the frequency table below. A cumulative frequency (or a “less than”) table can be drawn from this data. 8 8 +26 34 +32 66 +45 111 +37 148 +29 177 +16 193 +7 200 How old is the youngest/oldest person?
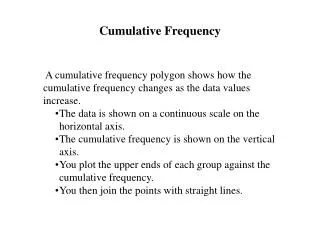
We can now use this to draw a cumulative frequency graph. 8 8 10 34 34 20 30 66 66 40 111 111 50 148 148 60 177 177 70 193 193 80 200 200
We can now use this to draw a cumulative frequency graph. 8 34 66 111 148 177 193 200
Cumulative Frequency graph. We can now use this to find the following information.. Median 37 Lower quartile 25 Upper quartile 51 Lowest Value 0 Highest Value 80 Interquartile range 51 - 25 26 This information can now be used to draw a box and whisker diagram..