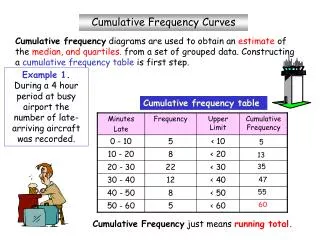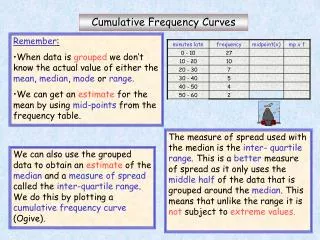
Cumulative Frequency Plots
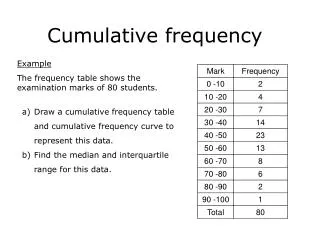
Cumulative Frequency Plots. Also called ogives. Cumulative Frequency Plots. Consider the shampoo data again from our last lesson. Cost per ounce of various shampoos (in cents). Cumulative Frequency Plots. The frequency table for the data (using a bin width of 10) is:. Frequency Table.

Cumulative Frequency Plots
E N D
Presentation Transcript
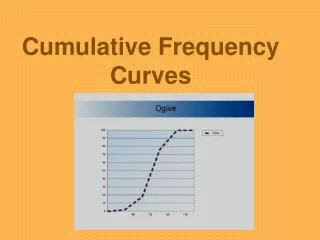
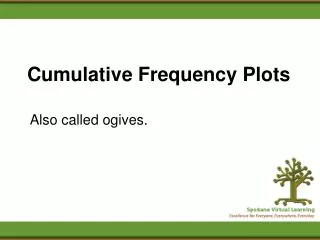
Cumulative Frequency Plots Also called ogives.
Cumulative Frequency Plots • Consider the shampoo data again from our last lesson. • Cost per ounce of various shampoos (in cents)
Cumulative Frequency Plots • The frequency table for the data (using a bin width of 10) is: Frequency Table
Cumulative Frequency Plots • The cumulative frequencies represent totals up to and including the bin. The cumulative frequency table would be: Cumulative Frequency Table
Cumulative Frequency Plots • The cumulative frequency histogram uses the values {2, 6, 9, 11, 12} for the vertical heights of the bins.
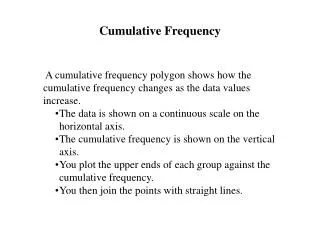
Cumulative Frequency Plots • You may also construct cumulative relative frequency plots. • These plots use cumulative relative frequency (obtained by dividing the cumulative frequency by the total for each of the bins). • The last bin will always have a relative frequency of 1 (think about why this is true).
Cumulative Frequency Plots • Use your TI calculator to construct cumulative frequency plots. • Follow the link below to work an example . • http://mathbits.com/MathBits/TISection/Statistics1/Cumulative.htm
Ogive (Pronounced “oh-jive”) Approximately 12 of the numbers in the sample are less than or equal to 2. You could make rectangles as in a histogram if you wanted to.
Cumulative Frequency Plots • This concludes the presentation.