Cumulative frequency
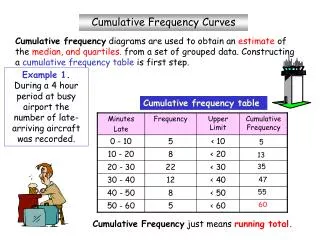
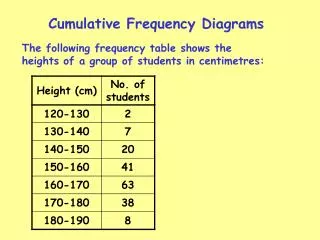
Example The frequency table shows the examination marks of 80 students. . Cumulative frequency. Draw a cumulative frequency table and cumulative frequency curve to represent this data. Find the median and interquartile range for this data. . Example

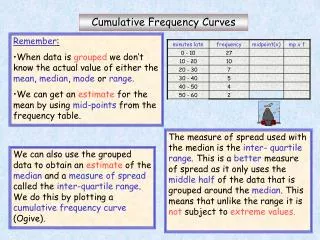
Cumulative frequency
E N D
Presentation Transcript
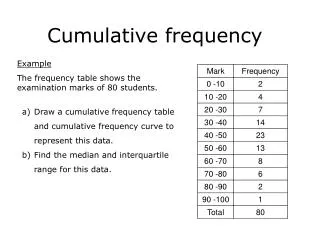
Example The frequency table shows the examination marks of 80 students. Cumulative frequency • Draw a cumulative frequency table and cumulative frequency curve to represent this data. • Find the median and interquartile range for this data.
Example The table below shows the results in a recent survey on the weights of boys in a particular school. a) Draw a cumulative frequency table and cumulative frequency curve to represent this data. b) Find the median and interquartile range for this data.
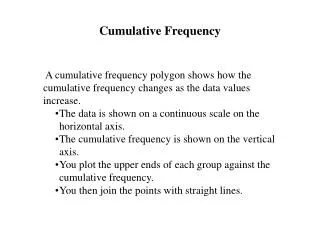
Example The masses of 150 girls were obtained and placed in the table below. a) Draw a cumulative frequency polygon which represents this data b) Find the median mass for these girls c) Find the interquartile range for this data d) What percentage had a weight less than 47kg?
Example The table below shows the age distribution of 200 people in a factory a) Draw a cumulative frequency curve to represent this data b) Use the curve to estimate the median c) What is the interquartile range for this data?