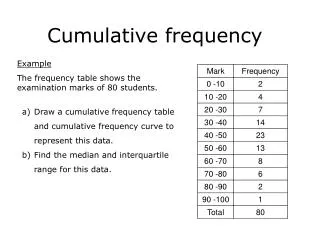
Cumulative Frequency Curves
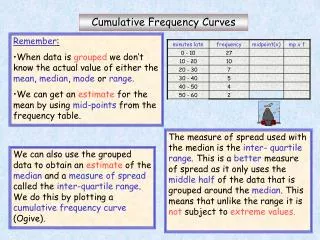
Cumulative Frequency Curves. Cumulative frequency diagrams are used to obtain an estimate of the median, and quartiles. from a set of grouped data. Constructing a cumulative frequency table is first step.

Cumulative Frequency Curves
E N D
Presentation Transcript
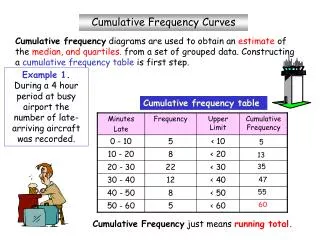
Cumulative Frequency Curves Cumulative frequency diagrams are used to obtain an estimate of the median, and quartiles. from a set of grouped data. Constructing a cumulative frequency table is first step. Example 1. During a 4 hour period at busy airport the number of late-arriving aircraft was recorded. Cumulative frequency table Minutes Late Frequency Upper Limit Cumulative Frequency 0 - 10 5 < 10 10 - 20 8 < 20 20 - 30 22 < 30 30 - 40 12 < 40 40 - 50 8 < 50 50 - 60 5 < 60 Cumulative Frequency just means running total. 5 13 35 47 55 60
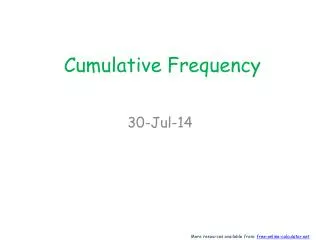
Plotting the curve 70 Cumulative frequency table 60 Mins Late f Upper Limit CF 50 0 - 10 5 < 10 5 ¾ 10 - 20 8 < 20 13 40 20 - 30 22 < 30 35 Cumulative Frequency ½ 30 30 - 40 12 < 40 47 40 - 50 8 < 50 55 20 ¼ 50 - 60 5 < 60 60 Median = 27 10 UQ = 38 LQ = 21 0 40 50 20 30 60 70 10 Minutes Late IQR = 38 – 21 = 17 mins Plot the end point of each interval against cumulative frequency,then join the points to make the curve. Find the lower quartile. Get an estimate for the median. Find the Upper Quartile. Find the Inter Quartile Range.(IQR = UQ - LQ)
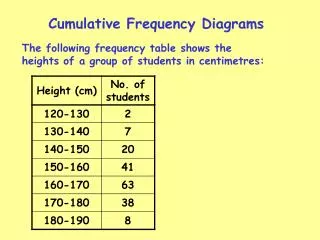
Cumulative frequency table Example 2.A P.E teacher records the distance jumped by each of 70 pupils. Distance (cm) No of pupils Upper Limit Cumulative Frequency 180 d 190 2 d 190 190 d 200 6 d 200 200 d 210 9 d 210 210 d 220 7 d 220 220 d 230 15 d 230 230 d 240 18 d 240 240 d 250 8 d 250 250 d 260 5 d 260 Cumulative Frequency Curves Cumulative frequency diagrams are used to obtain an estimate of the median and quartiles from a set of grouped data. Constructing a cumulative frequency table is first step. 2 8 17 24 39 57 65 70 Cumulative Frequency just means running total.
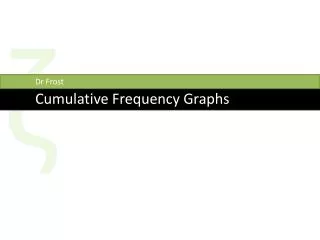
Plotting The Curve Cumulative Frequency Table ¾ 70 Distance jumped (cm) Number of pupils Cumulative Frequency 60 ½ 180 d 190 2 2 50 190 d 200 6 8 200 d 210 9 17 ¼ 40 Cumulative Frequency 210 d 220 7 24 Median = 227 30 220 d 230 15 39 UQ = 237 LQ= 212 230 d 240 18 57 20 240 d 250 8 65 250 d 260 5 70 10 0 180 190 200 210 220 230 240 250 260 Distance jumped (cm) IQR = 237 – 212 = 25 cm Plot the end point of each interval against cumulative frequency,then join the points to make the curve. Find the Lower Quartile. Get an estimate for the median. Find the Upper Quartile. Find the Inter Quartile Range.(IQR = UQ - LQ)
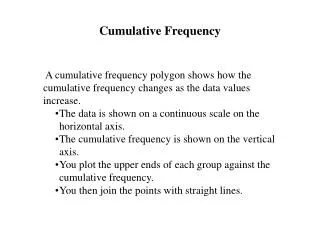
70 60 50 ¾ 40 Cumulative Frequency ½ IQR = 38 – 21 = 17 mins 30 20 ¼ Median = 27 10 UQ = 38 LQ = 21 0 40 50 20 30 60 70 10 Minutes Late 20 0 10 30 40 50 60 Box Plot from Cumulative Frequency Curve
70 60 50 Mins Late f Upper Limit CF 40 0 - 10 5 < 10 Cumulative Frequency 10 - 20 8 < 20 30 20 - 30 22 < 30 20 30 - 40 12 < 40 40 - 50 8 < 50 10 50 - 60 5 < 60 0 40 50 20 30 60 70 10 Minutes Late Example 1
Example 2 70 60 50 Distance jumped (cm) Number of pupils Cumulative Frequency 40 Cumulative Frequency 180 d 190 2 30 190 d 200 6 200 d 210 9 20 210 d 220 7 220 d 230 15 10 230 d 240 18 240 d 250 8 0 180 190 200 210 220 230 240 250 260 250 d 260 5 Distance jumped (cm)