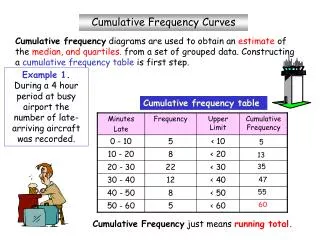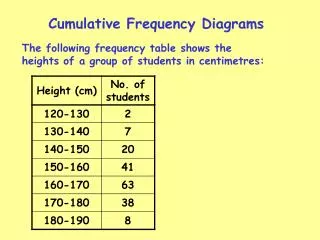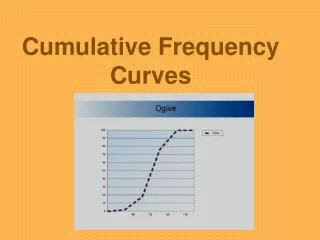
Cumulative Frequency Curves
Cumulative Frequency Curves. Outcomes…. Calculate the cumulative frequency Write down the upper class boundaries Plot the cumulative frequency curve Find the median value Find the upper and lower quartiles Find the inter-quartile range. Cumulative Frequency. Height (mm). 40 X 45.

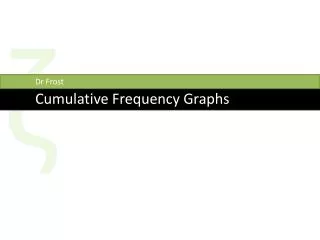
Cumulative Frequency Curves
E N D
Presentation Transcript
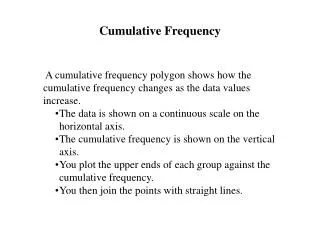
Outcomes… • Calculate the cumulative frequency • Write down the upper class boundaries • Plot the cumulative frequency curve • Find the median value • Find the upper and lower quartiles • Find the inter-quartile range
Height (mm) 40X45 45X50 50X55 55X60 7 12 Frequency F 15 3
Height (mm) 40X45 45X50 50X55 55X60 7 12 Frequency F 15 3 Cumulative Frequency
Height (mm) 40X45 45X50 50X55 55X60 7 12 Frequency F 15 3 Cumulative Frequency 7
Height (mm) 40X45 45X50 50X55 55X60 7 12 Frequency F 15 3 Cumulative Frequency 7 19
Height (mm) 40X45 45X50 50X55 55X60 7 12 Frequency F 15 3 Cumulative Frequency 7 19 34
Height (mm) 40X45 45X50 50X55 55X60 7 12 Frequency F 15 3 Cumulative Frequency 7 19 34 37
Height (mm) 40X45 45X50 50X55 55X60 7 12 Frequency F 15 3 Cumulative Frequency 7 19 34 37 Upper class boundary
Height (mm) 40X45 45X50 50X55 55X60 7 12 Frequency F 15 3 Cumulative Frequency 7 19 34 37 Upper class boundary 45
Height (mm) 40X45 45X50 50X55 55X60 7 12 Frequency F 15 3 Cumulative Frequency 7 19 34 37 Upper class boundary 45 50
Height (mm) 40X45 45X50 50X55 55X60 7 12 Frequency F 15 3 Cumulative Frequency 7 19 34 37 Upper class boundary 45 50 55
Height (mm) 40X45 45X50 50X55 55X60 7 12 Frequency F 15 3 Cumulative Frequency 7 19 34 37 Upper class boundary 45 50 55 60
Upper class boundary 45 50 55 60 Cumulative Frequency 7 19 34 37
Cress seedling height 40 30 Cumulative frequency 20 10 0 35 40 45 50 55 60 Height (mm)
Cress seedling height 40 30 Cumulative frequency 20 10 0 35 40 45 50 55 60 Height (mm)
Cress seedling height 40 30 Cumulative frequency 20 10 0 35 40 45 50 55 60 Height (mm)
Cress seedling height 40 30 Cumulative frequency 20 10 0 35 40 45 50 55 60 Height (mm)
Cress seedling height 40 30 Cumulative frequency 20 10 0 35 40 45 50 55 60 Height (mm)
Cress seedling height 40 30 Cumulative frequency 20 10 0 35 40 45 50 55 60 Height (mm)
Cress seedling height 40 30 Cumulative frequency 20 10 0 35 40 45 50 55 60 Height (mm)
Cress seedling height 40 30 Cumulative frequency 20 10 0 35 40 45 50 55 60 Height (mm)
Upper class boundary 45 50 55 60 Cumulative Frequency 7 19 34 37
Cress seedling height 40 30 Cumulative frequency 20 10 0 35 40 45 50 55 60 Height (mm)
Cress seedling height 40 30 Cumulative frequency 20 10 0 35 40 45 50 55 60 Height (mm)
Cress seedling height 40 30 Cumulative frequency 20 10 0 35 40 45 50 55 60 Height (mm)
Cress seedling height 40 30 Cumulative frequency 20 10 0 35 40 45 50 55 60 Height (mm) Median ≈ 49mm
Cress seedling height 40 30 Cumulative frequency 20 10 0 35 40 45 50 55 60 Height (mm) Median ≈ 49mm
The lower quartile tells us what value 25% of the sample are less than
The upper quartile tells us what value 75% of the sample are less than
We use the graph to find what lengths correspond to cumulative frequencies of 9.25 and 27.75
Cress seedling height 40 30 Cumulative frequency 20 10 0 35 40 45 50 55 60 Height (mm)
Cress seedling height 40 30 Cumulative frequency 20 10 0 35 40 45 50 55 60 Height (mm)
Cress seedling height 40 30 Cumulative frequency 20 10 0 35 40 45 50 55 60 Height (mm)
Cress seedling height 40 30 Cumulative frequency 20 10 0 35 40 45 50 55 60 Height (mm) LQ ≈ 45mm
Cress seedling height 40 30 Cumulative frequency 20 10 0 35 40 45 50 55 60 Height (mm)
Cress seedling height 40 30 Cumulative frequency 20 10 0 35 40 45 50 55 60 Height (mm)
Cress seedling height 40 30 Cumulative frequency 20 10 0 35 40 45 50 55 60 Height (mm)
Cress seedling height 40 30 Cumulative frequency 20 10 0 35 40 45 50 55 60 Height (mm) UQ ≈ 52mm
Median ≈ 49mm LQ ≈ 45mm UQ ≈ 52mm IQR ≈ UQ – LQ ≈ 7mm
Tells you the range of values occupied by the middle 50% of your sample