2.1 Frequency distribution Histogram, Frequency Polygon
150 likes | 389 Vues
2.1 Frequency distribution Histogram, Frequency Polygon. Example: page 43, problem 17 2114 2468 1000 1876 4278 1030 2000 1077 3981 1643 1858 1500 4105 3183 1932 1355 5835 1512 1697 2478 4608 7119. min. max. range = 7119 – 1000 = 6119 c.w. = 6119 ÷ 6 = 1019.8 → 1020

2.1 Frequency distribution Histogram, Frequency Polygon
E N D
Presentation Transcript
Example: page 43, problem 172114 2468 1000 1876 42781030 2000 1077 3981 16431858 1500 4105 3183 19321355 5835 1512 1697 24784608 7119 min max
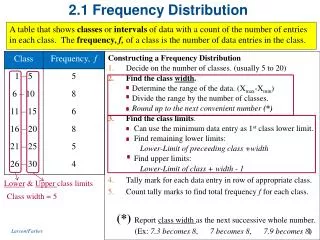
range = 7119 – 1000 = 6119 • c.w. = 6119 ÷ 6 = 1019.8 → 1020 • we will start the setup of the class limits with the minimum data value (1000), to which we will add the class width (c.w.) • this are the lower limits (where each class begins)
Next we determine the first class’ upper limit (where it ends) by subtracting 1 from the second class’ lower limit • 2020 – 1= 2019 • then we add again the class width (1020) to the upper class’ limits
now we evaluate the first classes midpoint by adding the two class limits and divide by 2 • 1000 + 2019 = 3019 • 3019 ÷ 2 = 1509.5 • Then we add the class width to the midpoint
HISTOGRAM • Is a bar graph with vertical bars • The bars are equal in width • The bars do touch each other • On the x-axis: class midpoint • On the y-axis: frequency • Important: label the axis, name your graph
FREQUENCY POLYGON • Is a closed shape • On the x-axis: class midpoint • On the y-axis: frequency • Important: label the axis, name your graph • Me might have to extend the marks on the x-axis to the left and/or to the right with one more class width.