Bitmap Technology for Data Exploration in SDM Center
Explore how bitmap technologies optimize feature tracking processes in scientific data. Discover efficient data selection techniques and parallel statistical analysis for large datasets. Contact John Wu and Chandrika Kamath.

Bitmap Technology for Data Exploration in SDM Center
E N D
Presentation Transcript
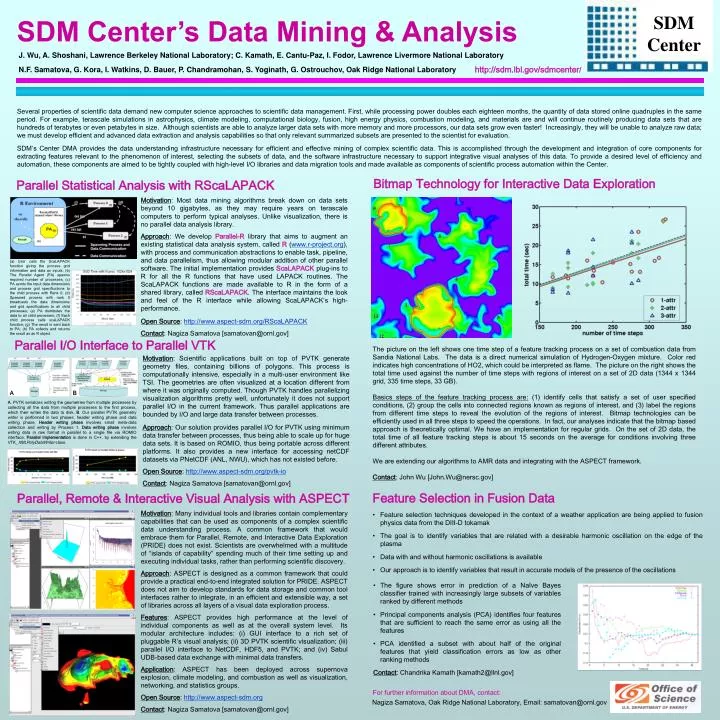
Bitmap Technology for Interactive Data Exploration SDM Center The picture on the left shows one time step of a feature tracking process on a set of combustion data from Sandia National Labs. The data is a direct numerical simulation of Hydrogen-Oxygen mixture. Color red indicates high concentrations of HO2, which could be interpreted as flame. The picture on the right shows the total time used against the number of time steps with regions of interest on a set of 2D data (1344 x 1344 grid, 335 time steps, 33 GB). Basics steps of the feature tracking process are: (1) identify cells that satisfy a set of user specified conditions, (2) group the cells into connected regions known as regions of interest, and (3) label the regions from different time steps to reveal the evolution of the regions of interest. Bitmap technologies can be efficiently used in all three steps to speed the operations. In fact, our analyses indicate that the bitmap based approach is theoretically optimal. We have an implementation for regular grids. On the set of 2D data, the total time of all feature tracking steps is about 15 seconds on the average for conditions involving three different attributes. We are extending our algorithms to AMR data and integrating with the ASPECT framework. Contact: John Wu [John.Wu@nersc.gov] A B • Feature selection techniques developed in the context of a weather application are being applied to fusion physics data from the DIII-D tokamak • The goal is to identify variables that are related with a desirable harmonic oscillation on the edge of the plasma • Data with and without harmonic oscillations is available • Our approach is to identify variables that result in accurate models of the presence of the oscillations • The figure shows error in prediction of a Naïve Bayes classifier trained with increasingly large subsets of variables ranked by different methods • Principal components analysis (PCA) identifies four features that are sufficient to reach the same error as using all the features • PCA identified a subset with about half of the original features that yield classification errors as low as other ranking methods • Contact: Chandrika Kamath [kamath2@llnl.gov] SDM Center’s Data Mining & Analysis J. Wu, A. Shoshani, Lawrence Berkeley National Laboratory; C. Kamath, E. Cantu-Paz, I. Fodor, Lawrence Livermore National Laboratory N.F. Samatova, G. Kora, I. Watkins, D. Bauer, P. Chandramohan, S. Yoginath, G. Ostrouchov, Oak Ridge National Laboratory http://sdm.lbl.gov/sdmcenter/ Several properties of scientific data demand new computer science approaches to scientific data management. First, while processing power doubles each eighteen months, the quantity of data stored online quadruples in the same period. For example, terascale simulations in astrophysics, climate modeling, computational biology, fusion, high energy physics, combustion modeling, and materials are and will continue routinely producing data sets that are hundreds of terabytes or even petabytes in size. Although scientists are able to analyze larger data sets with more memory and more processors, our data sets grow even faster! Increasingly, they will be unable to analyze raw data; we must develop efficient and advanced data extraction and analysis capabilities so that only relevant summarized subsets are presented to the scientist for evaluation. SDM’s Center DMA provides the data understanding infrastructure necessary for efficient and effective mining of complex scientific data. This is accomplished through the development and integration of core components for extracting features relevant to the phenomenon of interest, selecting the subsets of data, and the software infrastructure necessary to support integrative visual analyses of this data. To provide a desired level of efficiency and automation, these components are aimed to be tightly coupled with high-level I/O libraries and data migration tools and made available as components of scientific process automation within the Center. Parallel Statistical Analysis with RScaLAPACK • Motivation: Most data mining algorithms break down on data sets beyond 10 gigabytes, as they may require years on terascale computers to perform typical analyses. Unlike visualization, there is no parallel data analysis library. • Approach: We develop Parallel-R library that aims to augment an existing statistical data analysis system, called R (www.r-project.org), with process and communication abstractions to enable task, pipeline, and data parallelism, thus allowing modular addition of other parallel software. The initial implementation provides ScaLAPACK plug-ins to R for all the R functions that have used LAPACK routines.The ScaLAPACK functions are made available to R in the form of a shared library, called RScaLAPACK. The interface maintains the look and feel of the R interface while allowing ScaLAPACK’s high-performance. • Open Source: http://www.aspect-sdm.org/RScaLAPACK • Contact: Nagiza Samatova [samatovan@ornl.gov] (a) User calls the ScaLAPACK function giving the process grid information and data as inputs; (b) The Parallel Agent (PA) spawns required number of processes; (c) PA sends the Input data dimensions and process grid specifications to the child process with Rank 0; (d) Spawned process with rank 0 broadcasts the data dimensions and grid specifications to all child processes; (e) PA distributes the data to all child processes; (f) Each child process calls scaLAPACK function; (g) The result is sent back to PA; (h) PA collects and returns the result as an R object. Parallel I/O Interface to Parallel VTK • Motivation: Scientific applications built on top of PVTK generate geometry files, containing billions of polygons. This process is computationally intensive, especially in a multi-user environment like TSI. The geometries are often visualized at a location different from where it was originally computed. Though PVTK handles parallelizing visualization algorithms pretty well, unfortunately it does not support parallel I/O in the current framework. Thus parallel applications are bounded by I/O and large data transfer between processes. • Approach: Our solution provides parallel I/O for PVTK using minimum data transfer between processes, thus being able to scale up for huge data sets. It is based on ROMIO, thus being portable across different platforms. It also provides a new interface for accessing netCDF datasets via PNetCDF (ANL, NWU), which has not existed before. • Open Source: http://www.aspect-sdm.org/pvtk-io • Contact: Nagiza Samatova [samatovan@ornl.gov] A. PVTK serializes writing the geometries from multiple processes by collecting all the data from multiple processes to the first process, which then writes the data to disk. B. Our parallel PVTK geometry writer is performed in two phases: header writing phase and data writing phase.Header writing phase involves small meta-data collection and writing by Process 1. Data writing phase involves writing data in raw format in parallel to a single file via ROMIO interface. Parallel Implementation is done in C++, by extending the VTK_XMLPolyDataWriter class. Feature Selection in Fusion Data Parallel, Remote & Interactive Visual Analysis with ASPECT • Motivation: Many individual tools and libraries contain complementary capabilities that can be used as components of a complex scientific data understanding process. A common framework that would embrace them for Parallel, Remote, and Interactive Data Exploration (PRIDE) does not exist. Scientists are overwhelmed with a multitude of “islands of capability” spending much of their time setting up and executing individual tasks, rather than performing scientific discovery. • Approach: ASPECT is designed as a common framework that could provide a practical end-to-end integrated solution for PRIDE. ASPECT does not aim to develop standards for data storage and common tool interfaces rather to integrate, in an efficient and extensible way, a set of libraries across all layers of a visual data exploration process. • Features: ASPECT provides high performance at the level of individual components as well as at the overall system level. Its modular architecture includes: (i) GUI interface to a rich set of pluggable R’s visual analysis; (ii) 3D PVTK scientific visualization; (iii) parallel I/O interface to NetCDF, HDF5, and PVTK; and (iv) Sabul UDB-based data exchange with minimal data transfers. • Application: ASPECT has been deployed across supernova explosion, climate modeling, and combustion as well as visualization, networking, and statistics groups. • Open Source: http://www.aspect-sdm.org • Contact: Nagiza Samatova [samatovan@ornl.gov] For further information about DMA, contact: • Nagiza Samatova, Oak Ridge National Laboratory, Email: samatovan@ornl.gov