Download
1 / 9
90 likes | 207 Vues
Featured Article :. Mechanisms of Glucose Lowering of Dipeptidyl Peptidase-4 Inhibitor Sitagliptin When Used Alone or With Metformin in Type 2 Diabetes A double-tracer study. Carolina Solis-Herrera, M.D., Curtis Triplitt, P.H.A.R.M.D.,

E N D
Featured Article: Mechanisms of Glucose Lowering of Dipeptidyl Peptidase-4 Inhibitor Sitagliptin When Used Alone or With Metformin in Type 2 Diabetes A double-tracer study Carolina Solis-Herrera, M.D., Curtis Triplitt, P.H.A.R.M.D., Jose de Jesús Garduno-Garcia, M.D., John Adams, B.S., Ralph A. DeFronzo, M.D. Eugenio Cersosimo, M.D., P.H.D. Diabetes Care Volume 36: 2756-2762 September, 2013
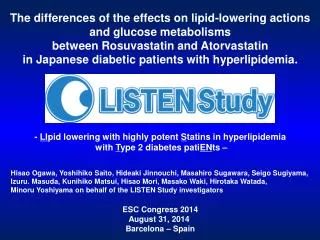
STUDY OBJECTIVE • To assess glucose-lowering mechanisms of sitagliptin (S), metformin (M), and the two combined (M+S) Solis-Herrera C. et al. Diabetes Care 2013;36:2756-2762
STUDY DESIGN AND METHODS • 16 patients with T2DM were randomized to four 6-week treatments with placebo (P), M, S, and M+S • After each period, subjects received a 6-h meal tolerance test (MTT) with [14C]glucose to calculate glucose kinetics • Fasting plasma glucose (FPG), fasting plasma insulin, C-peptide, fasting plasma glucagon, and bioactive glucagon-like peptide (GLP-1) and gastrointestinal insulinotropic peptide (GIP) were measured Solis-Herrera C. et al. Diabetes Care 2013;36:2756-2762
RESULTS • FPG decreased from P, 160 ± 4 to M, 150 ± 4; S, 154 ± 4; and M+S, 125 ± 3 mg/dL • Mean post-MTT plasma glucose decreased from P, 207 ± 5 to M, 191 ± 4; S, 195 ± 4; and M+S, 161 ± 3 mg/dL • Increase in mean post-MTT plasma insulin and in insulin secretory rate was similar in P, M, and S and slightly greater in M+S • Fasting plasma glucagon was equal with all treatments Solis-Herrera C. et al. Diabetes Care 2013;36:2756-2762
RESULTS • Significant drop occurred during the initial 120 min with S 24% and M+S • 34% vs. P 17% and M 16% • Fasting and mean post-MTT plasma bioactive GLP-1 were higher after S and M+S vs. M and P • Basal endogenous glucose production (EGP) fell • Although the EGP slope of decline was faster in M and M+S vs. S, all had comparable greater post-MTT EGP inhibition vs. P Solis-Herrera C. et al. Diabetes Care 2013;36:2756-2762
CONCLUSIONS • M+S combined produce additive effects to: • 1) Reduce FPG and postmeal PG • 2) Augment GLP-1 secretion and -cell function • 3) Decrease plasma glucagon • 4) Inhibit fasting and postmeal EGP compared with M or S monotherapy Solis-Herrera C. et al. Diabetes Care 2013;36:2756-2762