Internal Combustion Engine Testing
Internal Combustion Engine Testing. Kanit Wattanavichien. What is I.C. Engine. Internal combustion engines (ICE) the internal combustion engine is characterised by:

Internal Combustion Engine Testing
E N D
Presentation Transcript
Internal Combustion Engine Testing Kanit Wattanavichien
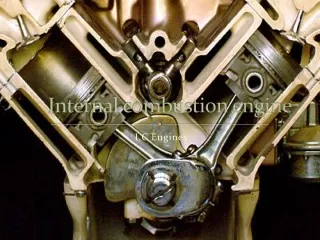
What is I.C. Engine Internal combustion engines (ICE) • the internal combustion engine is characterised by: “The working fluid composition changes during its passage through the engine. Energy is released by combustion and the added heat is, in part, converted into work.” • strictly speaking, this description includes not only reciprocating engines, but gas turbines as well. In this chapter we will consider only: • ‘reciprocating internal combustion engines’ or R.I.C.E
A I R Fuel Injector Air Combustion Products Intake Stroke Compression Stroke Power Stroke Exhaust Stroke Basic operation of a four stroke engine:
Direct Injection quiescent chamber Direct Injection multi-hole nozzle swirl in chamber Direct Injection single-hole nozzle swirl in chamber Indirect injection swirl pre-chamber
Engine Geometry Vd = Compression ratio rc = Vc – Vd Vc
Engine Indicating Diagram & Valve Timing Digram Valve overlaps
Engine Testing • Part A • Engine Inspection • Part B • Energy Balance on an Engine and Engine Performance • Part C • Cylinder Pressure Measurement
Torque and Power Torque is measured off the output shaft using a dynamometer. b Force F Stator Rotor N Load cell The torque exerted by the engine is T:
b Force F Stator Rotor N Load cell Torque and Power Torque is measured off the output shaft using a dynamometer. The torque exerted by the engine is T: The power delivered by the engine turning at a speed N and absorbed by the dynamometer is: Note: w is the shaft angular velocity in units rad/s
Torque is a measure of an engine’s ability to do work and power is the rate at which work is done The term brake power, , is used to specify that the power is measured at the output shaft, this is the usable power delivered by the engine to the load. The brake power is less than the power generated by the gas in the cylinders due to mechanical friction and parasitic loads (oil pump, air conditioner compressor, etc… The power produced in the cylinder is termed the indicated power, .
Indicated Work per Cycle Given the cylinder pressure data over the operating cycle of the engine one can calculate the work done by the gas on the piston. This data is typically given as P vs V The indicated work per cycle is given by WA > 0 WB < 0 Power W>0 Compression W<0 Exhaust W<0 Intake W>0
Work per Cycle Gross indicated work per cycle – net work delivered to the piston over the compression and expansion strokes only: Wi,g =area A + area C (>0) Pump work – net work delivered to the gas over the intake and exhaust strokes: Wp =area B + area C (<0) Net indicated work per cycle – work delivered over all strokes: Wi,n = Wi,g – Wp = (area A + area C) – (area B – area C) = area A – area B
Indicated Power • Indicated power: • where N – crankshaft speed in rev/s • nR – number of crank revolutions per cycle • = 2 for 4-stroke • = 1 for 2-stroke • Power can be increased by increasing: • the engine size, Vd • compression ratio,rc • engine speed, N
Indicated Work at Part Throttle At WOT the pressure at the intake valve is just below atmospheric pressure, However at part throttle the pressure is much lower than atmospheric Pint Therefore at part throttle the pump work (area B+C) can be significant compared to gross indicated work (area A+C)
Indicated Work with Supercharging Engines with superchargers or turbochargers can have intake pressures greater than the exhaust pressure, giving a positive pump work Pint Wi,n = area A + area B Supercharges increase the net indicated work but is a parasitic load since they are driven by the crankshaft
Mechanical Efficiency Some of the power generated in the cylinder is used to overcome engine friction and to pump gas into and out of the engine. The term friction power, , is used to collectively describe these power losses, such that: Friction power can be measured by motoring the engine. The mechanical efficiency is defined as:
Mechanical Efficiency (2) • Mechanical efficiency depends on throttle position, engine design • and engine speed. • Typical values for car engines at WOT are: • 90% @2000 RPM and 75% @ max speed. • Throttling increases pumping work and thus decreases the brake power • so the mechanical efficiency drops and approaches zero at idle. • Power varies with speed but torque is “independent” of engine speed
Power and Torque versus Engine Speed Rated brake power There is a maximum in the brake power versus engine speed called the rated brake power (RBP). At higher speeds brake power decreases as friction power becomes significant compared to the indicated power 1 kW = 1.341 hp • There is a maximum in the torque versus • speed called maximum brake torque (MBT). • Brake torque drops off: • at lower speeds do to heat losses • at higher speeds it becomes more difficult to • ingest a full charge of air. Max brake torque
Indicated Mean Effective Pressure (IMEP) imep is a fictitious constant pressure that would produce the same work per cycle if it acted on the piston during the power stroke. imep does not depend on engine speed, just like torque imep is a better parameter than torque to compare engines for design and output because it is independent of engine speed, N, and engine size, Vd. Brake mean effective pressure (bmep) is defined as:
The maximum bmep of good engine designs is well established: Four stroke engines: SI engines: 850-1050 kPa* CI engines: 700 -900 kPa Turbocharged SI engines: 1250 -1700 kPa Turbocharged CI engines: 1000 - 1200 kPa Two stroke engines: Standard CI engines comparable bmep to four stroke Large slow CI engines: 1600 kPa *Values are at maximum brake torque at WOT Note, at the rated (maximum) brake power the bmep is 10 - 15% less Can use above maximum bmep in design calculations to estimate engine displacement required to provide a given torque or power at a specified speed.
Maximum BMEP • The maximum bmep is obtained at WOT at a particular engine speed • Closing the throttle decreases the bmep • For a given displacement, a higher maximum bmep means more torque • For a given torque, a higher maximum bmep means smaller engine • Higher maximum bmep means higher stresses and temperatures in the • engine hence shorter engine life, or bulkier engine. • For the same bmep 2-strokes have almost twice the power of 4-stroke
Just some part of energy from Fuel are available at engine shaft.