Stock Optimisation
Stock Optimisation. Needs for Optimisation. Needs for Optimisation Fabricators and Operators are aware of the increasing needs to optimise costs nowadays Business no longer depends on the sale of the product but also the support throughout its life cycle

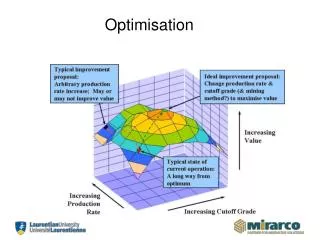
Stock Optimisation
E N D
Presentation Transcript
Needs for Optimisation Needs for Optimisation • Fabricators and Operators are aware of the increasing needs to optimise costs nowadays • Business no longer depends on the sale of the product but also the support throughout its life cycle • 30% of the total costs rely on the acquisition of the aircraft • 70% of the total costs are consequence of the operation during the life cycle. • There is a need to investigate and develop new solutions to impulse customer support to new frontiers • There is a need to create new calculation methods to meets the on going needs to optimise logistics. The services provided by any operator are based on the availability of its aircrafts.
The Concept as a Concept • A small company with the support of a powerful business group • Zero investment • Advantages of within the structure of a powerful business group: • Include a New Product into the Catalogue • Include a New Suppliers into the company´s structure • Offer a new product to Current Clients • Offer a new product to New Clients • Analysis results give the client support in the decision making strategies
Positioning in ILS Positioning of in ILS • is focused on giving key optimisation support to the provisioning areas of ILS throughout the MRO product cycle. Maintenance Actions ANALYSIS PREPARATION MEANS PRODUCTION SUPERVISION Formation & Experience Operator Quality System Regulatory Environment Procedure Organisation GSE Provisioning Spares Provisioning A/C Configuration Maintenance Program Technical Publications
Product Concept Catalogue of Products NO AVAILABILTY = NO PROFIT NO SPARES = NO AVAILABILITY = NO PROFIT NO GSE = NO AVAILABILTY = NO PROFIT • Optimisation of the products within the ILS supply chain by Improving Availability. • Turn Around Time (TAT) Optimisation • Investment optimisation by Selling of Overstock • Support given to the client’s Decision Making Strategies • Critical GSE Identification • Support to the Strategically Purchase Planification • Forecast to buy Critical Equipment
Basis of the Theory Basis of the Theory presented by • OVER-INVESTMENT IN GSE IN PROVISIONING, OR RISK OF GSE SHORTAGE?
Case Study 1 Support Organisation under study • Stations • GSE Suppliers (x4) • Supplier 1 – Demand Factor: 16% • Supplier 2 – Demand Factor: 20% • Supplier 3 – Demand Factor: 26% • Supplier 4 - Demand Factor: 38% • MRO Centre (x1) • Operator (x2) • Fleet Allocation (x2) • Fleet • 31 x Aircraft 1 • 15 x Aircraft 2 • 6 x Aircraft 3
Case Study 1 • Input Data for the Stations • Input Data for the Aircrafts • MOEs to Study per GSE is pioneering of the calculation of all the GSE “usability” parameters. So, the data above will not be provided by the company, will define all variables according to the support organization data and circunstances.
Analysis of Efficiency Current GSE Provisioning Strategy of the Analysed MRO
Analysis of Efficiency Current GSE Provisioning Strategy of the Analysed MRO POINT 1 (RISK OF SHORTAGE) : ROS: 49,88% GSE INVESTMENT : 7,070,000.00 USD
Analysis of Efficiency Efficiency Improvement vs. Cost Oblique Optimisation Current GSE Provisioning Strategy CE CURVE POINT 1 (AVAILABILITY) : Availability : 79,13% GSE INVESTMENT : 7,070,000.00 USD OPTIMUM POINT (AVAILABILITY): Availability: 95,83% GSE INVESTMENT: 5,570,000.00 USD Optimized GSE Provisioning Strategy
Analysis of Efficiency POINT 1 (RISK OF SHORTAGE): ROS: 49,88% GSE INVESTMENT: 7,070,000.00 USD OPTIMUM POINT (RISK OF SHORTAGE): ROS: 11,54% GSE INVESTMENT: 5,570,000.00 USD Risk of Shortage vs. Cost Oblique Optimisation
Analysis of Efficiency Efficiency Improvement & Cost Optimisation Among the optimum points curve, and depending on the customer´s needs, three different kinds of optimizations can be applied: • VERTICAL OPTIMIZATION: Higher availability of aircrafts can be ensured with the same investment. • HORIZONTAL OPRIMIZATION: Lower investment provisioning strategy can be defined to reach the same A/C availability. • OBLIQUE OPTIMIZATION: Higher A/C availability with a lower investment in GSEs. We take into account the third option. Chosing a point and comparing it with the point obtained before concerning the current strategy, we can create a Cost / Efectiveness Diagram in which the scenario is Current GSE Provisioning Strategy VS Optimized GSE Provisioning Strategy.
Analysis of Efficiency Comparing Point1 vs. the Optimum Point Δ(A) = 95,83 - 79,13 = +16,7% ROS Δ(ROS) = 11,54 - 49,88 = -38,34% A Δ(ROS) = 11,54 - 49,88 = -38,34%
Analysis of Efficiency Oblique Optimisation GSE Provisioning
Analysis of Efficiency Efficiency Improvement vs. Cost Horizontal Optimisation POINT 1 (AVAILABILITY): Availability: 79,13% GSE INVESTMENT: 7,070,000.00 USD H-OPTIMUM POINT (AVAILABILITY): Availability: 79,97% GSE INVESTMENT: 1,765,000.00 USD
Analysis of Efficiency Horizontal Optimisation GSE Provisioning RADICAL GSE INVESTMENT REDUCTION CAN BE REACHED BY PERFORMING THE HORIZONTAL OPTIMIZATION. THE AVAILABILITY LEVELS WON´T BE AFFECTED.
Analysis of Efficiency Efficiency Improvement vs. Cost Vertical Optimisation POINT 1 (AVAILABILITY): Availability: 79,13% GSE INVESTMENT: 7,070,000.00 USD H-OPTIMUM POINT (AVAILABILITY): Availability: 97,04% GSE INVESTMENT: 6,850,000.00 USD
Analysis of Efficiency Vertical Optimisation GSE Provisioning VERTICALLY, THE EFFECTIVENESS IMPROVES HIGHLY, BY KEEPING THE PREVIOUS GSE PROVISIONING INVESTMENT RANGE.
Analysis of Efficiency Critical Needs in Time Resource Allocation Strategy with Time • Expensive GSEs • For GSE39 – PN39 the Optimum Stock Level has been analysed to be 7 units. The current stock is 2 units, ie. The company will need to invest in 5 units to maintain 95.83% availability • 5 x GSE39 = 5 x 100,000.00 USD = 500,000.00 USD • Large GSEs • For GSE43 – PN43 has an extremely large size, taking into account that the Optimum Stock Level has been analysed to be 2 units. We need to study for how long will the company maintain 95.83% Availability with just 1 unit of GSE43.
Analysis of Results Analysis of the Oblique Stock Results • Analysis the current effectiveness of the MRO centre & GSE provisioning investment. • Current Availability = 79.13% • Current GSE Provisioning Investment = 7,070,000.00 USD • Simulation 1: Optimised point curve calculated for current MRO status vs. range of investment. • Oblique Optimisation: The effectiveness is improved , GSE provisioning investment reduced • Optimised Availability: 95.38% • Optimised GSE Provisioning Investment: 5,570,000.00 USD • Stock: • Optimum Stock Levels found for each P/N • Current Stock vs. Optimised Stock compared defining Stock to be purchased and sold. Immediate earnings potential = 1,780,000.00 USD • Simulation 2: Calculation of the GSE purchase Delay Allowance • High Expense GSE (GSE39): 1.2 years of delay gained • Large GSE (GSE43): 0.56 years of delay gained
Analysis of Results Analysis of the Horizontal Stock Results • Analysis the current effectiveness of the MRO centre & GSE provisioning investment. • Current Availability = 79.13% • Current GSE Provisioning Investment = 7,070,000.00 USD • Simulation 1: Optimised point curve calculated for current MRO status vs. range of investment. • Horizontal Optimisation: The effectiveness is improved, GSE provisioning investment reduced • Optimised Availability: 79.97% • Optimised GSE Provisioning Investment: 1,765,000.00 USD • Stock: • Optimum Stock Levels found for each P/N • Current Stock vs. Optimised Stock compared defining Stock to be purchased and sold. Immediate earnings potential = 5,305,000.00 USD
Analysis of Results Analysis of the Vertical Stock Results • Analysis the current effectiveness of the MRO centre & GSE provisioning investment. • Current Availability = 79.13% • Current GSE Provisioning Investment = 7,070,000.00 USD • Simulation 1: Optimised point curve calculated for current MRO status vs. range of investment. • Vertical Optimisation: The effectiveness is improved, GSE provisioning investment reduced • Optimised Availability: 97.04% • Optimised GSE Provisioning Investment: 6,850,000.00 USD • Stock: • Optimum Stock Levels found for each P/N • Current Stock vs. Optimised Stock compared defining Stock to be purchased and sold. Immediate earnings potential = 215,000.00 USD
What if Analysis What if Analysis • Another optimisation service is the What if Analysis. This study will simulate different scenarios in which we can vary customer´s utilisation factors of the different aircrafts. • “HOW WOULD THE EFFECTIVENESS CHANGE IF THE CUSTOMER 1 WAS OPERATING ITS AIRCRAFT 1 FLEET AT 0,5, AND CUSTOMER 2 WAS OPERATING ITS AIRCRAFT 3 AT 0,5 RATE AS WELL?” UTILF = 0,5