Enhancing Institutional Assessment: Utilizing NSSE Data at School of Visual Arts
370 likes | 463 Vues
Learn how School of Visual Arts leverages NSSE data for accreditation, assessment, and student support services for lifelong learning experiences.

Enhancing Institutional Assessment: Utilizing NSSE Data at School of Visual Arts
E N D
Presentation Transcript
NSSE and Accreditation Self-Study Christopher Cyphers, Ph.D. Provost School of Visual Arts New York, New York
SVA at a glance Location: Manhattan Carnegie: Specialized Degrees: BFA, MFA, MTA, MPS Physical plant: 675,000 ft2 Beds: 1,100 UG enrollment: 3,100 GR enrollment: 407 % female: 52.6 % full-time: 93.4 % on campus: 32.8 % international: 13.4 States represented: 45 Countries represented: 47 First-time, full-time freshmen: 661 % female: 56.6 % full-time: 100 % in-state: 34.8 % on campus: 65.4 % international: 10.6 States represented: 36 Countries represented: 14 First-time persistence rate (2005 cohort): 86.4% First-time graduation rate (2000 cohort): 65%
Greater emphasis on assessment Learning in the major Co- and extracurricular learning Written, oral, critical thinking, analytical skills Foundation for lifelong learning Academic advisement Student support services
Let’s do it You commit to administering NSSE You achieve a healthy response rate You receive your results in a smart and tidy package You proudly take your results binder to your president, and he says:
Okay. . . . Now what? “This is great. . . what do we do with it”?
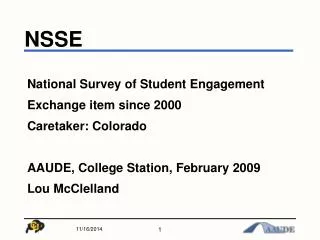
Why NSSE? Focused on students’ academic and student life experience, better than comparable instruments. NSSE embraced by Middle States Commission on Higher education. Numerous opportunities to benchmark institution’s data against peer groups. NSSE generated benchmark scores, “standardized” so as to Comparisons over time.
Comparative value of NSSE data Institutional Scores Across Time First-Year versus Seniors Institutional Scores Against Peer Groups
How does SVA compare to. . . SVA Independent Art Schools (AICAD) NSSE-Selected Carnegie Peers All NSSE Respondents
Linking NSSE data to other data sources Institutional Date NSSE Data Other Assessment Data Multidimensional Dataset
Use of NSSE for Middle States accreditation Standard 7: Institutional Assessment Standard 9: Student Support Services Standard 10: Faculty Standard 11: Educational Offerings Standard 12: General Education Standard 14: Learning Outcomes Assessment
Institutional assessment Using mean scores to make comparisons across peer groups
What to consider Effect size Statistical significance Class year
Student support services *p < .05, **p < .01, ***p < .001
Student life *p < .05, **p < .01, ***p < .001
Personal development *p < .05, **p < .01, ***p < .001
General Education *p < .05, **p < .01, ***p < .001
General education, II *p < .05, **p < .01, ***p < .001
Assessment in the major or general education *p < .05, **p < .01, ***p < .001
Overall satisfaction/quality of relationships *p < .05, **p < .01, ***p < .001
NSSE benchmark scores Concise summaries of data along five measurement scales
Dissecting benchmark scales Level of Academic Challenge (SVA) Item 1 Item 2 Item 1 Item 3 Item 4 Major Field Gender Item 5 Item 6 Residence GPA First-Year Prgm
Differences based on major *p < .05, **p < .01, ***p < .001
Differences based on first-year program *p < .05, **p < .01, ***p < .001
Differences based on Gender Persistence rates are generally higher for men than women. However, women enjoy a higher 6-year graduation rate. *p < .05, **p < .01, ***p < .001
Differences based on local residency *p < .05, **p < .01, ***p < .001
Christopher Cyphers School of Visual Arts 209 East 23 Street New York, NY 10010 ccyphers@sva.edu 212-592-2550