Data Intensive Cyberinfrastructure
The accelerating pace of data creation, projected to reach 1,200 exabytes, necessitates powerful cyberinfrastructure for effective management and analysis. Advanced computational systems, including multifaceted architectures and cloud solutions, are essential for handling vast data streams across various domains, from particle physics to medical research. Innovations in parallel computing and cloud technology provide the backbone for this data explosion, enabling scientists to transform raw data into actionable knowledge and driving progress across multiple fields of inquiry.

Data Intensive Cyberinfrastructure
E N D
Presentation Transcript
Data Intensive Cyberinfrastructure Geoffrey Fox I400 March 8 2011
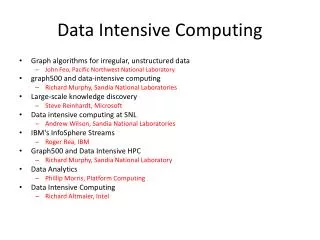
Big Data in Many Domains • According to one estimate, mankind created 150 exabytes (billion gigabytes) of data in 2005. This year, it will create 1,200 exabytes • PC’s have ~100 Gigabytes disk and 4 Gigabytes of memory • Size of the web ~ 3 billion web pages: MapReduce at Google was on average processing 20PB per day in January 2008 • During 2009, American drone aircraft flying over Iraq and Afghanistan sent back around 24 years’ worth of video footage • http://www.economist.com/node/15579717 • New models being deployed this year will produce ten times as many data streams as their predecessors, and those in 2011 will produce 30 times as many • ~108 million sequence records in GenBank in 2009, doubling in every 18 months • ~20 million purchases at Wal-Mart a day • 90 million Tweets a day • Astronomy, Particle Physics, Medical Records … • Most scientific task shows CPU:IO ratio of 10000:1 – Dr. Jim Gray • The Fourth Paradigm: Data-Intensive Scientific Discovery • Large Hadron Collider at CERN; 100 Petabytes to find Higgs Boson
Data Deluge => Large Processing Capabilities • CPUs stop getting faster • Multi /Many core architectures • Thousand cores in clusters and millions in data centers • Parallelism is a must to process data in a meaningful time Converting raw data to knowledge Requires large processing capabilities > O (n) Image Source: The Economist
http://research.microsoft.com/en-us/um/redmond/events/TonyHey/21216/player.htmhttp://research.microsoft.com/en-us/um/redmond/events/TonyHey/21216/player.htm
What is Cyberinfrastructure Cyberinfrastructure is (from NSF) infrastructure that supports distributed research and learning (e-Science, e-Research, e-Education) Links data, people, computers Exploits Internet technology (Web2.0 and Clouds) adding (via Grid technology) management, security, supercomputers etc. It has two aspects: parallel – low latency (microseconds) between nodes and distributed – highish latency (milliseconds) between nodes Parallel needed to get high performance on individual large simulations, data analysis etc.; must decompose problem Distributed aspect integrates already distinct components – especially natural for data (as in biology databases etc.) 17
e-moreorlessanything ‘e-Science is about global collaboration in key areas of science, and the next generation of infrastructure that will enable it.’ from inventor of term John Taylor Director General of Research Councils UK, Office of Science and Technology e-Science is about developing tools and technologies that allow scientists to do ‘faster, better or different’ research Similarly e-Business captures the emerging view of corporations as dynamic virtual organizations linking employees, customers and stakeholders across the world. This generalizes to e-moreorlessanything including e-DigitalLibrary, e-SocialScience, e-HavingFunand e-Education A deluge of data of unprecedented and inevitable size must be managed and understood. People (virtual organizations), computers, data (including sensors and instruments)must be linked via hardware and software networks 18
Important Trends • Data Deluge in all fields of science • Multicoreimplies parallel computing important again • Performance from extra cores – not extra clock speed • GPU enhanced systems can give big power boost • Clouds – new commercially supported data center model replacing compute grids (and your general purpose computer center) • Light weight clients: Sensors, Smartphones and tablets accessing and supported by backend services in cloud • Commercial efforts moving much faster than academia in both innovation and deployment
Lightweight Cyberinfrastructure to support mobile Data gathering expeditions plus classic central resources (as a cloud)
“The Universe is now being explored systematically, in a panchromatic way, over a range of spatial and temporal scales that lead to a more complete, and less biased understanding of its constituents, their evolution, their origins, and the physical processes governing them.” • Towards a National Virtual Observatory Tracking the Heavens Hubble Telescope Palomar Telescope Sloan Telescope
Virtual Observatory Astronomy GridIntegrate Experiments Radio Far-Infrared Visible Dust Map Visible + X-ray Galaxy Density Map
Particle Physics at the CERN LHC ATLAS at LHC, 2006-2020 150*106 sensors UA1 at CERN 1981-1989 "hermetic detector" LHC experimental collaborations (e.g. ATLAS) typically involve over 100 institutes and over 1000 physicists world wide
European Grid Infrastructure Status April 2010 (yearly increase) • 10000 users: +5% • 243020 LCPUs (cores): +75% • 40PB disk: +60% • 61PB tape: +56% • 15 million jobs/month: +10% • 317 sites: +18% • 52 countries: +8% • 175 VOs: +8% • 29 active VOs: +32% NSF & EC - Rome 2010
TeraGrid Example: Astrophysics • Science: MHD and star formation; cosmology at galactic scales (6-1500 Mpc) with various components: star formation, radiation diffusion, dark matter • Application: Enzo (loosely similar to: GASOLINE, etc.) • Science Users: Norman, Kritsuk (UCSD), Cen, Ostriker, Wise (Princeton), Abel (Stanford), Burns (Colorado), Bryan (Columbia), O’Shea (Michigan State), Kentucky, Germany, UK, Denmark, etc.
TeraGrid Example: Petascale Climate Simulations • Science: Climate change decision support requires high-resolution, regional climate simulation capabilities, basic model improvements, larger ensemble sizes, longer runs, and new data assimilation capabilities. Opening petascale data services to a widening community of end users presents a significant infrastructural challenge. • 2008 WMS: We need faster higher resolution models to resolve important features, and better software, data management, analysis, viz, and a global VO that can develop models and evaluate outputs Realistic Antarctic sea-ice coverage generated from century-scale high resolution coupled climate simulation performed on Kraken (John Dennis, NCAR) • Applications: many, including: CCSM (climate system, deep), NRCM (regional climate, deep), WRF (meteorology, deep), NCL/NCO (analysis tools, wide), ESG (data, wide) • Science Users: many, including both large (e.g., IPCC, WCRP) and small groups; • ESG federation includes >17k users, 230 TB data, 500 journal papers (2 years)
DNA Sequencing Pipeline Illumina/Solexa Roche/454 Life Sciences Applied Biosystems/SOLiD Pairwise clustering Blocking MDS Internet Visualization Plotviz Form block Pairings Sequence alignment Dissimilarity Matrix N(N-1)/2 values FASTA FileN Sequences ~300 million base pairs per day leading to ~3000 sequences per day per instrument ? 500 instruments at ~0.5M$ each Read Alignment MPI MapReduce
TeraGrid Example: Genomic Sciences • Science: many, ranging from de novo sequence analysis to resequencing, including: genome sequencing of a single organism; metagenomic studies of entire populations of microbes; study of single base-pair mutations in DNA • Applications: e.g. ANL’s Metagenomics RAST server catering to hundreds of groups, Indiana’s SWIFT aiming to replace BLASTX searches for many bio groups, Maryland’s CLOUDburst, BioLinux • PIs: thousands of users and developers, e.g. Meyer (ANL), White (U. Maryland), Dong (U. North Texas), Schork (Scripps), Nelson, Ye, Tang, Kim (Indiana) Results of Smith-Waterman distance computation, deterministic annealing clustering, and Sammon’s mapping visualization pipeline for 30,000 metagenomics sequences: (a) 17 clusters for full sample; (b) 10 sub-clusters found from purple and green clusters in (a). (Nelson and Ye, Indiana) Map sequence clusters to 3D
Steps in Data Analysis Again • Gather data – patient records or Gene Sequencer • Store Data – Database or “collection of files” • SQL does not have a good reputation as best way to query scientific data • Partly as need to do substantial processing on data • Note there is raw data and data about data aka. Metadata • Metadata can be stored in databases as not analyzed • Process data – e.g. BLAST compares new gene sequences with database of existing sequences • Analyze results and write papers etc.
Highlight: NanoHub Harnesses TeraGrid for Education • Nanotechnology education • Used in dozens of courses at many universities • Teaching materials • Collaboration space • Research seminars • Modeling tools • Access to cutting edge research software
Data Sources • Common Themes of Data Sources • Focus on geospatial, environmental data sets • Data from computation and observation. • Rapidly increasing data sizes • Data and data processing pipelines are inseparable.
Highlight: SCEC using gateway to produce hazard map • PSHA hazard map for California using newly released Earthquake Rupture Forecast (UCERF2.0) calculated using SCEC Science Gateway • Warm colors indicate regions with a high probability of experiencing strong ground motion in the next 50 years. • High resolution map, significant CPU use
SDSC Machine Room SDSC’s DataStar–one of the 50 fastest computers in the world HowTerashake Works • Map the blocks on to processorsof the supercomputer • Run the simulationusing current information on fault activity and the physics of earthquakes
Data parking of 100s of TBs for many months “Fat Nodes” with 256 GB of DS for pre-processing and post visualization 10-20 TB data archived a day 240 procs on SDSC Datastar, 5 days, 1 TBof main memory 47 TB output data for 1.8 billion grid points Continuous I/O 2GB/sec SCEC Data Requirements Resources must support a complicated orchestration of computation and data movement Parallelfile system Dataparking The next generation simulation will require even more resources: Researchers plan to double the temporal/spatial resolution of TeraShake “I have desired to see a large earthquake simulation for over a decade. This dream has been accomplished.” Bernard Minster, Scripps Institute of Oceanography
USArray Seismic Sensors
a Site-specific Irregular Scalar Measurements a Constellations for Plate Boundary-Scale Vector Measurements Ice Sheets a Volcanoes PBO Greenland Long Valley, CA Topography 1 km Stress Change Northridge, CA Earthquakes Hector Mine, CA
US Cyberinfrastructure Context • There are a rich set of facilities • Production TeraGrid facilities with distributed and shared memory • Experimental “Track 2D” Awards • FutureGrid: Distributed Systems experiments cf. Grid5000 • Keeneland: Powerful GPU Cluster • Gordon: Large (distributed) Shared memory system with SSD aimed at data analysis/visualization • Open Science Grid aimed at High Throughput computing and strong campus bridging
TeraGrid • ~2 Petaflops; over 20 PetaBytes of storage (disk and tape), over 100 scientific data collections UW Grid Infrastructure Group (UChicago) UC/ANL PSC NCAR PU NCSA Caltech UNC/RENCI IU ORNL USC/ISI NICS SDSC LONI TACC Resource Provider (RP) Software Integration Partner Network Hub
TeraGrid Resources and Services • Computing: ~2 PFlops aggregate • more than two PFlops of computing power today and growing • Ranger: 579 Tflop Sun Constellation resource at TACC • Kraken: 1.03 Pflop Cray XT5 NICS/UTK • Remote visualization servers and software • Spur: 128 core, 32 GPU cluster connected to Ranger’s interconnect • Longhorn: 2048 core, 512 GPU cluster directly connected to Ranger’s parallel file system • Nautilus: 1024 core, 16 GPU, 4 TB SMP directly connected to parallel file system shared with Kraken • Data • allocation of data storage facilities • over 100 Scientific Data Collections • Central allocations process • single process to request access to (nearly) all TG resources/services • Core/Central services • documentation • User Portal • EOT program • Coordinated technical support • central point of contact for support of all systems • Advanced Support for TeraGrid Applications (ASTA) • education and training events and resources • over 30 Science Gateways
Resources Evolving • Recent and anticipated resources • Track 2D awards • Dash/Gordon (SDSC), Keeneland (GaTech), FutureGrid (Indiana) • XD Visualization and Data Analysis Resources • Spur (TACC), Nautilus (UTK) • “NSF DCL”-funded resources • PSC, NICS/UTK, TACC, SDSC • Other • Ember (NCSA) • Continuing resources • Ranger, Kraken • Retiring resources • most other resources in TeraGrid today will retire in 2011 • Attend BoFs for more on this: • New Compute Systems in the TeraGrid Pipeline(Part 1) • Tuesday, 5:30-:700pm in Woodlawn I • New Compute Systems in the TeraGrid Pipeline(Part 2) • Wednesday, 5:15-6:45pm in Stoops Ferry
Impacting Many Agencies(CY2008 data) Supported Research Funding by Agency Resource Usage by Agency University Industry 1% 1% International 3% University Other Industry DOD Other International 2% 1% 6% 5% 2% 0% DOD 1% NASA NASA NSF 9% 10% 49% NIH NSF NIH 15% 19% NSF DOE 52% NIH DOE NASA 11% DOD DOE International 13% University $91.5M Direct Support of Funded Research 10B NUs Delivered Other Industry
Across a Range of Disciplines 19 Others Advanced Earth Sciences 4% Scientific 5% Computing 6% Physics Materials 26% Research 6% Chemical, Thermal Systems 6% Chemistry Molecular 7% Biosciences 18% Atmospheric Sciences Astronomical 8% Sciences 14% >27B NUs Delivered in 2009
Ongoing Impact • More the 1,200 projects supported • 54 examples highlighted in most recent TG Annual Report • atmospheric sciences, biochemistry and molecular structure/function, biology, biophysics, chemistry, computational epidemiology, environmental biology, earth sciences, materials research, advanced scientific computing, astronomical sciences, computational mathematics, computer and computation research, global atmospheric research, molecular and cellular biosciences, nanoelectronics, neurosciences and pathology, oceanography, physical chemistry • 2009 TeraGrid Science and Engineering Highlights • 16 focused stories • http://tinyurl.com/TeraGridSciHi2009-pdf • 2009 EOT Highlights • 12 focused stories • http://tinyurl.com/TeraGridEOT2009-pdf