Download
1 / 6
80 likes | 450 Vues
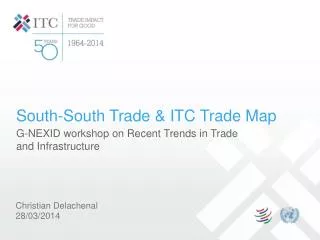
South-South Trade & ITC Trade Map. G-NEXID workshop on Recent T rends in Trade and Infrastructure . Christian Delachenal 28/03/2014. Evolution of South-South exports between 2002 and 2012. South-South exports have increased more rapidely than South exports to the world.

E N D
South-South Trade & ITC Trade Map G-NEXID workshop on Recent Trends in Trade and Infrastructure Christian Delachenal 28/03/2014
Evolution of South-South exports between 2002 and 2012 South-South exports have increased more rapidelythan South exports to the world Bilateraltradebetween Latin America and Africarepresentslessthan US$ 30B in 2012 Annualgrowth of world trade exports South regions have increasedtheir world marketshare
BilateraltradebetweenAfrica and ASEAN+IN+CN in 2012 Africa’s exports are concentrated on mineral fuel China is the most important player Asean++ exports are more diversified Source: Trade Map http://www.trademap.org
BilateraltradebetweenLatin America and ASEAN+IN+CN in 2012 Latin Americamainly exports mineral fuel and ores China is the most important player Asean++ exports are more diversified Source: Trade Map http://www.trademap.org
Bilateraltradebetween Latin Americaand Africa in 2012 Latin Americamainly exports agricultural products Brazilis the most important player Africa’s exports are concentrated on mineral fuel Source: Trade Map http://www.trademap.org
Trade Mapcharacteristics Trade Map is an online application on international tradeflows. For more than 160 countries (~95 of world trade), yearlydata at the 2, 4 or 6 digit levelof the HS nomenclature isavailablefrom 2001 onwards. 2013 yearlytrade data isavailable for 78 countries, representing85% of world trade. Trade Map providesmirrorstatistics for non-reportingcountries. Monthly and quarterly data isavailablefor more than100 countries, representingaround90% of world trade. January2014 data isavailablefor 22 countries fromthe HS 2-digit levelto the tariffline level. Company data isavailable in Trade Map for more than 550,000 importing or exportingcompanies, covering 60 countries. The source of company data is Kompass International. Trade Map isavailable in English, French and Spanish.