Download
1 / 53
530 likes | 694 Vues
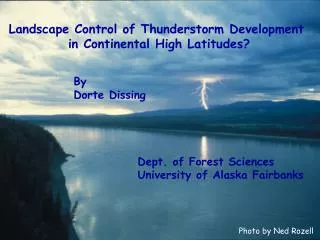
Landscape Control of Thunderstorm Development in Continental High Latitudes?. By Dorte Dissing Dept. of Forest Sciences University of Alaska Fairbanks. Photo by Ned Rozell. Committee: Dave Verbyla Terry Chapin John Fox Peter Olsson John Yarie. Acknowledgements.

E N D
Landscape Control of Thunderstorm Development in Continental High Latitudes? By Dorte Dissing Dept. of Forest Sciences University of Alaska Fairbanks Photo by Ned Rozell
Committee: Dave Verbyla Terry Chapin John Fox Peter Olsson John Yarie Acknowledgements Numerous discussions: Folks at NWS Programming assistance: Jonathan Henkelman Bob Bolton Nazila Merati, PMEL Lightning data: Thor Weatherby, AFS Satellite Imagery: Kevin Engle Last, but not least: BJ Bennedsen Friends and Family
Outline: Introduction Motivation – why are thunderstorms important in Alaska? Chapter 2: Spatial Patterns of Lightning Strikes in Interior Alaska and their Relations to Elevation and Vegetation Chapter 3: A potential mechanism for wildfire-feedback in Alaskan boreal forest: do burn scars increase lightning activity ? Chapter 4: Thunderstorm Activity in Interior Alaska for the Summer of 2001 General Conclusions – what did we learn? Suggestions for future Work
Motivation – Why study lightning in Alaska? Lightning responsible for most area burned Great ecological disturbance factor Importance for global carbon budget Alaska in a region of highest predicted changes due to climate warming Land-atmosphere interface - needed research to improve predictions of climate change (Harding et al., 2001)
Alaska Geography Lightning Detection Network Fort Yukon Bettles Tanana Fairbanks Dawson Unalakleet Galena Mayo McGrath Tanacross Burwash
Chapter 2: Spatial Patterns of Lightning Strikes in Interior Alaska and their Relations to Elevation and Vegetation. Correlating lightning strikes (mean of 1986-99) with elevation and vegetation at 3 scales Regional scale - Interior Alaska (630,000km2) Mesoscale - 6 Longitudinal Transects (100,000km2) Local Scale - 17 Physiographic Regions (50,000km2)
Longitudinal transects 144-148° 152-156° 141-144° 160-164° 148-152° 156-160°
Lightning Strike Density – Interior Alaska Forest coverage Lightning Strike Density
Proximity Study - Tundra Pixels
Relations to Treeline? Forest Pixels
Multiple Regression Analysis I) Lightning strike density = a1 + b1 (elevation zone) II) Lightning strike density = a2 + b2 (%boreal forest) III) Lightning strike density = a3 + b3(%boreal forest) + c3 (elevation zone) IV) Lightning strike density = a4 + b4 (%boreal forest) + c4 (elevation zone) + d4 (%boreal forest*elevation zone) Best Models
Chapter 2. Conclusions Regional Scale (Interior Alaska) * Most of the pixels with the highest lightning strike densities falls within 10-25km on either side of the boundary between boreal forest and tundra. • Mesoscale (Longitudinal Transects) • * Higher lightning strike densities within the boreal forest, followed by shrubs and tundra. • - More pronounced in the continental than in the maritime climate. • Local Scale (Physiographic Regions) • Elevation and %boreal forest do not provide as good an explanation for the variability in lightning strike data as at the mesoscale
Chapter 2, Overall Interpretation * Boreal forest, due to its high sensible heat fluxes, may enhance convective activity of thunderstorms. * The boreal forest biome exists in a climatic region that sustains the convective activity. * Our data suggest that both explanations are important. * Beringer et al. (2001): Differences in energy partitioning between tundra and boreal forest possibly significant enough to drive local scale circulations of ecological importance. * Influence stronger at the larger scales (regional and mesoscale), but was less prevalent at the smallest scale (local).
Chapter 3: A potential mechanism for wildfire-feedback in Alaskan boreal forest: do burn scars increase lightning activity? - Why expect a feedback mechanism? Chambers and Chapin (2003): Found large differences in heat fluxes between burned and unburned areas, largest after 5-7 years post-fire Knowles (1993): Simulated wildfire burn scar induced circulations and suggest those strong enough to produce lightning - why Yukon Flats region as study area?
3-Step Analysis 1) When is there a potential for local thunderstorms? * Duration and magnitude of elevated temperature in burn scars Lout vs Rn 2) Any evidence of the circulation systems? * Convective clouds in the vicinity of fire scars? * Changes over time in lightning strike time series 3) Important driving factors? * Correlations between lightning strike activity and environmental variables
Control Area 2 Control Area 3 Porcupine River 855 985 858 Control Area 1 993 895 13 1002 16 891 Yukon River 1099 998 905 1004
1 1 Sample size 134 1 2 1 3 4 2 9 13 13 6 13 13 13 13 4 11 11 Step 1 [years after] Fire
Convective clouds over fire scar... Terrain induced clouds? 25km Step 2 N
Step 2 25km N Fires Convective clouds over fire scar... Terrain induced clouds?
Step 2 Lightning activity changes at fire scars
Fraction of normalized lightning per area [*10000] Lightning Strike Densities
The Impossibility of this study! Spatial and temporal resolution of satellite imagery table First attempt to find data evidence Interactions between circulations Fire severity Is this potential feedback mechanism really worth worrying about ? More work clearly needs to be done...
Conclusions Fire scars maintain an elevated temperature for at least 10 years following a fire (AVHRR: 1.06 +/- 0.69°C) Overall trends in lightning?? Yukon Flats / Interior Alaska - Landscape Mosaic - makes analysis like this challenging
Chapter 4: Thunderstorm Activity in Interior Alaska for the Summer of 2001 Main objectives (1) spatial distribution of CAPE, LI, thundercloud occurrences and lightning strikes and their relationships to the underlying surface for the summer season of 2001 (2) to evaluate CAPE and LI as diagnostic indicators of convective and lightning activity in Interior Alaska under various meteorological conditions.
Terminology Alaska thunderstorms divided into two categories: (After Biswas and Jayaweera, 1976) Synoptic: Widespread thunderstorm activity Often caused by fronts Few days every year Lots of lightning strikes (> 1000 strikes/day) Airmass: Local thunderstorm activity Airmass influenced by underlying surface Most days with lightning Fewer lightning strikes (< 1000 strikes/day)
LI CAPE First 2 Weeks of June, 2001 Thunderclouds Lightning
43 0-25 25-50 50-75 75-100 31 32 61 27 53 141-144° 144-148° 148-152° 160-164° 152-156° 156-160°
CAPE, veg, elev LI, veg, elev CAPE, veg, elev LI, veg, elev Thundercloud Occurrence Airmass Days CAPE LI Synoptic Days CAPE LI
Conclusions, Chapter 4. * Good match-ups in spatial relationships between CAPE, LI, thunderclouds and lightning * Explained variation in lightning strike activity and thundercloud occurrences in some cases were more than 30% larger on airmass then on synoptic days (vegetation and elevation added) to CAPE and LI. *LI in most cases is a slightly better predictor than CAPE. *In Alaska, electrically intense thunderstorms can be found at CAPE values as low as 300-400 Jkg-1. - Related to dry (high-based) thunderstorms that result from the relatively dry boundary layer typical of Interior Alaska?
General Conclusions A hierarchy of spatial scales Future under a changing climate Suggestions for future work
A hierarchy of spatial scales Processes and important variables for development of thunderstorms and lightning activity vary both within and between the scales. At the larger scales, boreal forest and elevation influence lightning strike activity -less so at the smallest scale (local). At very small scales (burn scars) - exceedingly difficult to isolate influential signals and factors. 45 by 45km area - The underlying surface (forest coverage and elevation) has more of an influence on convective development on days with airmass storms than on days with synoptic storms.
Factors we have “identified” as important for thunderstorm and lightning activity in Interior Alaska, and comment on their likely response to climate change: * CAPE * Treeline expansion * Fire severity * Length of fire season * Topography Future under a changing climate Links between climate, vegetation and fire are very important for the boreal environment, but still poorly defined under present conditions (Campbell and Flannigan, 2000).
Alaska scenario: CAPE values lower than southern U.S. / tropics Projected temperature changes higher significant increase in lightning occurrence? CAPE Climate sensitivity of CAPE to surface temperature is only ~ 50-100JKg-1EC-1 (Ye et al. 1998) Unlikely that climate warming induced changes are significant enough to be detected in the global electric circuit (Ye et al. 1998).
Treeline expansion 2 x CO2 scenarios (Smith, 1992): Poleward shift of forested zones: Boreal forest into present tundra Mixed deciduous forest into present boreal forest • Position of polar front along northern boreal treeline • influenced by treeline? (Pielke and Vidale, 1995) • 34% of Alaskan thunderstorms associated with polar front • (Biswas and Jayaweera, 1976) More synoptic or more airmass thunderstorms? Predictions not simple…
Paleoecology: warm dry climate frequent small fires cooler, moist climate larger, widespread fires Fire severity Increase in boreal forest zone with global warming? - forest composition - migration of new species into region? - elusive wildfire feedback mechanism… Length of fire season Canada: 40% increase in annual area burned (Flannigan and Van Wagner, 1991) Length of fire season in Canadian boreal forest: + ~30 days (Wotton and Flannigan, 1993) Alaska
GPS Station Velocities 1997-2001, Fletcher (2002) FAIR FAIR Tintina fault Tintina fault GRNR HEALY Denali fault Denali fault Future Topography…
Suggestions for future work * Produce a dry thunderstorm climatology for Interior Alaska, similar to the work of Rorig and Ferguson (1999, 2001) in Washington state. * Correlations with topography, patch sizes, patch shapes (burn scar analysis and treeline proximity study). * Compare fire starts (ignition) and lightning data (weather data). Anderson (2001) has produced model for this. * Field measurements chasing evidence for wildfire burn scar feedback mechanism
Questions? Yeah lots, but answers??? Photo by Ned Rozell
SatelliteSpatial ResolutionTemporal Resolution Landsat 4,5 TM30m / 60m thermalEvery 16 days Landsat 7 ETM30m / 60m thermalEvery 16 days AVHRR1.09km Twice a day GOES1-4kmEvery half hour return