Graph Transformations
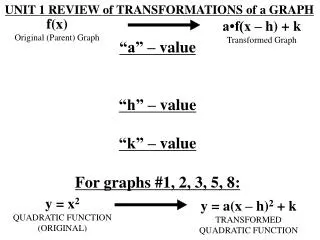
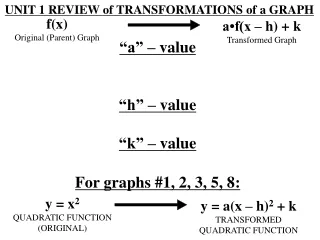
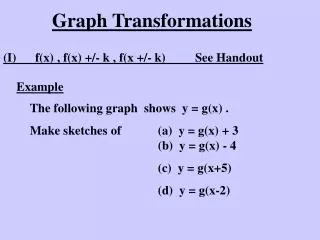
Graph Transformations. (I) f(x) , f(x) +/- k , f(x +/- k) See Handout. Example. The following graph shows y = g(x) . Make sketches of (a) y = g(x) + 3 (b) y = g(x) - 4 (c) y = g(x+5) (d) y = g(x-2). y = g(x). (31, 7). (23, 2). X.

Graph Transformations
E N D
Presentation Transcript
Graph Transformations (I) f(x) , f(x) +/- k , f(x +/- k) See Handout Example The following graph shows y = g(x) . Make sketches of (a) y = g(x) + 3 (b) y = g(x) - 4 (c) y = g(x+5) (d) y = g(x-2)
y = g(x) (31, 7) (23, 2) X Key points are (23,2) and (31,7). To transform the graph transform the points.
For y = g(x) + 3 move everything 3 units up. (23,2) (23,5) (31,7) (31,10) y = g(x) + 3 (31, 10) (23, 5) X
For y = g(x) - 4 move everything 4 units down. (23,2) (23,-2) (31,7) (31,3) y = g(x) - 4 (31, 3) X (23, -2)
For y = g(x+5) move everything 5 units left. (23,2) (18,2) (31,7) (26,7) y = g(x+5) (26, 7) (18, 2) X
For y = g(x-2) move everything 2 units right. (23,2) (25,2) (31,7) (33,7) y = g(x-2) (33, 7) (25, 2) X
NB: (I) +/- changes outside the brackets slide the graph in the Y direction in the way you would expect. ie + goes up & - goes down. (II) +/- changes inside the brackets slide the graph in the X direction in the opposite way to which you would expect. ie + goes back & - goes forward .
Example The graph below shows y = f(x) Make sketches of (I) y = -f(x) (II) y = f(-x) y = f(x) (14,6) (17,5) X 12 Main points are (12,0), (14,6) & (17,5).
For y = -f(x) we reflect in the X-axis. (12,0)(12,0) (14,6)(14,-6) (17,5)(17,-5) X 12 (17,-5) (14,-6) y = -f(x) NB: max TP now min TP & min TP now max TP.
For y = f(-x) we reflect in the Y-axis. (12,0)(-12,0) (14,6)(-14,6) (17,5)(-17,5) y = f(-x) (-14,6) (-17,5) X -12
Example Here is the graph of y = f(x) Make sketches of (I) y = 4 f(x) (II) y = f(3x) y = f(x) (12,2) X (3,-1) Main points are (12,2) & (3,-1).
(I) To obtain y = 4 f(x) we stretch the graph vertically by a factor of 4 (ie mult y-coords by 4). (12,2)(12,8) (3,-1)(3,-4) y = 4f(x) (12,8) X (3,-4)
(II) To obtain y = f(3x) we squash the graph horizontally by a factor of 3 (ie divide x-coords by 3). (12,2)(4,2) (3,-1)(1,-1) y = f(3x) (4,2) X (1,-1)
Trig Graphs The same transformation rules apply to the basic trig graphs. NB: If f(x) =sinx then 3f(x) = 3sinx and f(5x) = sin5x Think about sin replacing f ! Also if g(x) = cosx then g(x) –4 = cosx –4 and g(x+90) = cos(x+90) Think about cos replacing g !
Example Sketch the graph of y = sinx - 2 ! If sinx = f(x) then sinx - 2 = f(x) - 2 So move the sinx graph 2 units down. y = sinx - 2
Example Sketch the graph of y = cos(x - 50) ! If cosx = f(x) then cos(x - 50) = f(x - 50) So move the cosx graph 50 units right. y = cos(x - 50)
Example Sketch the graph of y = 3sinx ! If sinx = f(x) then 3sinx = 3f(x) So stretch the sinx graph 3X vertically. y = 3sinx
Example Sketch the graph of y = cos4x ! If cosx = f(x) then cos4x = f(4x) So squash the cosx graph to 1/4 size horizontally. y = cos4x
Example Sketch the graph of y = 2sin3x ! If sinx = f(x) then 2sin3x = 2f(3x) So squash the sinx graph to 1/3 size horizontally and also double its height. y = 2sin3x